 Zostať
Podmienky obchodovania
Nástroje


The EUR/USD currency pair stood still on Tuesday, with the price previously reaching the area of 1.1907-1.1922 and also testing the Senkou Span B line. Now, for the trend to shift back upward, this barrier must be overcome. However, on the second trading day of the week, traders found no grounds for any market movements. Even the only somewhat significant report on US retail sales did not help traders break through the 1.1907-1.1922 area, despite the report being worse than forecast.
Thus, we conclude that the market has paused before an important day. Why is Wednesday an important day? Because the Non-Farm Payroll and unemployment reports will finally be published, they remain tied to the Fed's monetary policy. Recall that the Fed has decided to pause any easing, as it wants to wait to see the full effects of the rate cuts on the labor market. However, according to Powell himself, the effects of rate changes can take 6-12 months to manifest. It is unlikely that the Fed will wait this long to confirm the weakness of the labor market and the ineffectiveness of three rate cuts. Thus, every new report on Non-Farm Payrolls or unemployment is a potential threat to the dollar and a potential catalyst for a rise in "dovish" expectations in the market.
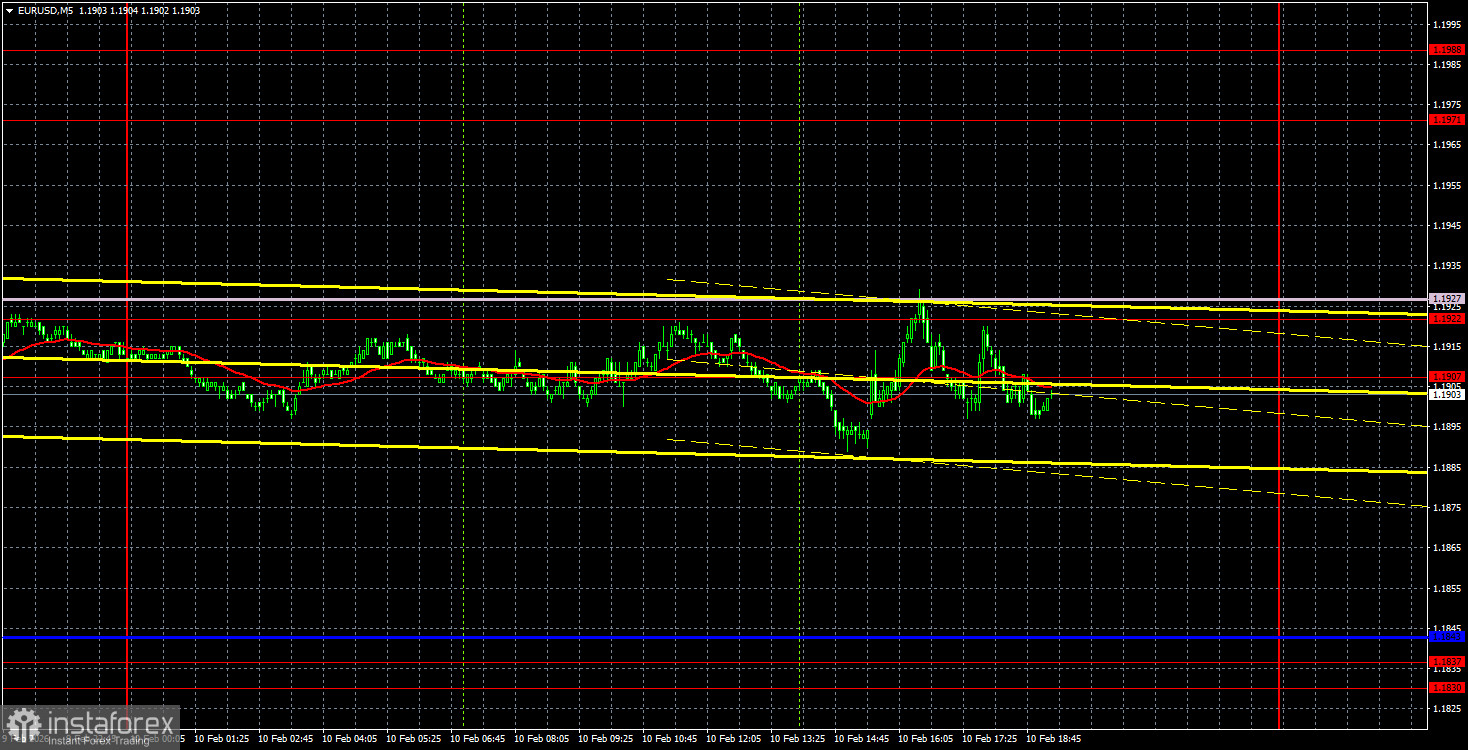
On the 5-minute timeframe yesterday, movements were so minimal that we did not even highlight any trading signals. The price moved sideways throughout the day, and only at the very beginning of the American trading session did it attempt to "break free" from the area of 1.1907-1.1922. However, this did not succeed, and the price quickly returned to a narrow range.
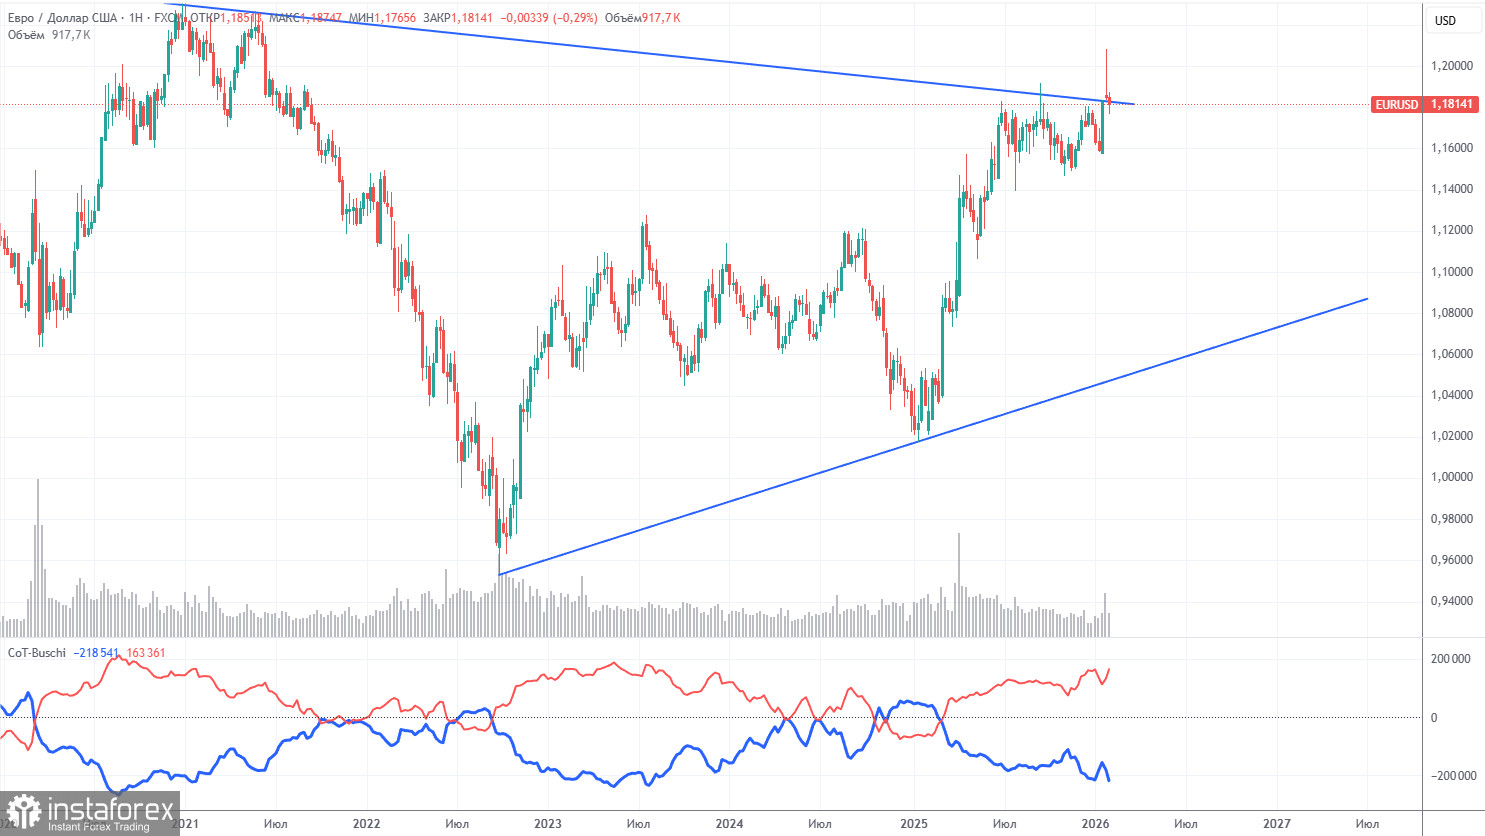
The latest COT report is dated February 3. The illustration on the weekly timeframe clearly shows that the net position of non-commercial traders remains "bullish." Since Trump took office as President of the United States for the second time, the dollar has been in a downward trend. We cannot say with 100% certainty that the decline of the American currency will continue, but current developments around the world point in that direction.
We still do not see any fundamental factors that would strengthen the European currency, but there are plenty of factors that would weaken the American dollar. The global downward trend remains intact, but how important is it where the price has moved over the past 18 years? In the last three years, a new upward trend has been forming, and a breakout of the global descending trend line has occurred. Thus, the path is open for further upward movement.
The positioning of the red and blue lines of the indicator continues to indicate a "bullish" trend. During the last reporting week, the number of longs in the "Non-commercial" group increased by 11,900, while the number of shorts decreased by 19,300. Consequently, the net position increased by another 31,200 contracts over the week.
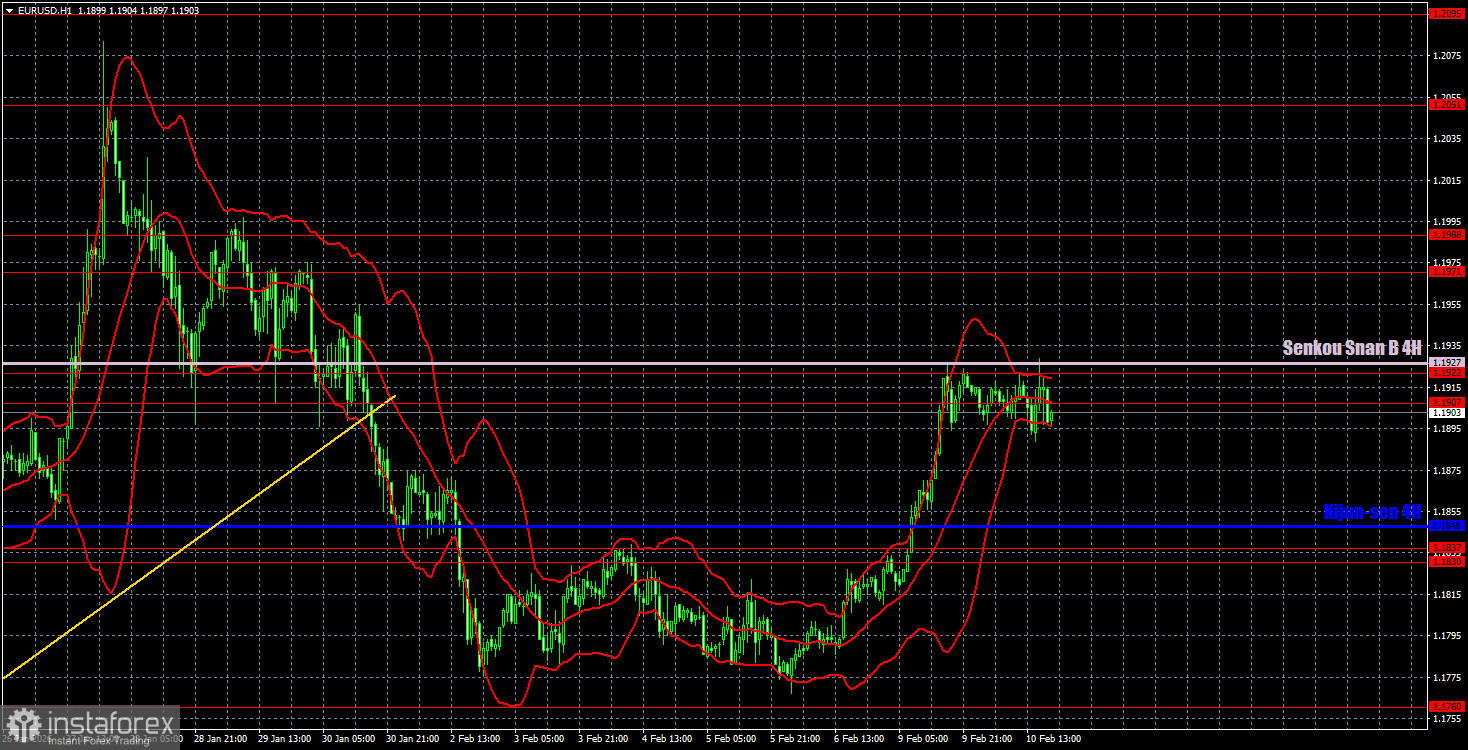
On the hourly timeframe, the EUR/USD pair continues to form an upward trend despite breaking the trendline and undergoing a correction. The pair left the sideways channel of 1.1400-1.1830 at the beginning of the year, where it spent seven months, thus officially resuming the upward trend. For the technical restoration of the upward trend, price consolidation above the Senkou Span B line is now required.
On February 11, we highlight the following levels for trading: 1.1362, 1.1426, 1.1542, 1.1604-1.1615, 1.1657-1.1666, 1.1750-1.1760, 1.1830-1.1837, 1.1907-1.1922, 1.1971-1.1988, 1.2051, 1.2095, as well as the Senkou Span B line (1.1927) and the Kijun-sen line (1.1848). The Ichimoku indicator lines may move throughout the day, which should be taken into account when determining trading signals. Don't forget to set a Stop Loss order to break even if the price moves in the right direction by 15 pips. This will protect against potential losses if the signal turns out to be false.
For Wednesday, no important events are scheduled in the Eurozone. Still, they are not needed, as the market is already fully focused on the US labor market and unemployment data, which will be published at the beginning of the American trading session. These reports could provoke a strong market reaction, which is impossible to predict in advance.
On Wednesday, traders may trade from the area of 1.1907-1.1922. New longs will become relevant with consolidation above this area and the Senkou Span B line, targeting 1.1971-1.1988. Short positions can be considered if there is a bounce from the 1.1907-1.1927 area, targeting 1.1848.
InstaForex analytical reviews will make you fully aware of market trends! Being an InstaForex client, you are provided with a large number of free services for efficient trading.


