empty
 
 
Chystáte sa opustiť
www.instaforex.eu >
webovú stránku, ktorú prevádzkuje
INSTANT TRADING EU LTD
Otvoriť účet

13.02.202606:48 Forex Analysis & Reviews: How to Trade the EUR/USD Currency Pair on February 13? Simple Tips and Trade Analysis for Beginners

Relevance up to 23:00 2026-02-13 UTC--5
Tieto informácie poskytujeme retailovým a profesionálnym klientom ako súčasť marketingovej komunikácie. Neobsahujú investičné poradenstvo, investičné odporúčania, ponuku ani výzvu na vykonanie transakcie alebo použitie stratégie na finančných nástrojoch a ani by sa tak nemalo s nimi zaobchádzať. Minulá výkonnosť nie je zárukou ani predikciou budúceho výkonu. Spoločnosť Instant Trading EU Ltd. neručí a nepreberá žiadnu zodpovednosť za správnosť a úplnosť poskytovaných informácií ani za stratu, ktorá by vyplynula z akejkoľvek investície založenej na analýze, predpovedi alebo iných informáciách poskytnutých zamestnancom spoločnosti alebo iným spôsobom. Celé vylúčenie zodpovednosti nájdete tu.

Analysis of Thursday's Trades:

1H Chart of the EUR/USD Pair

Exchange Rates 13.02.2026 analysis

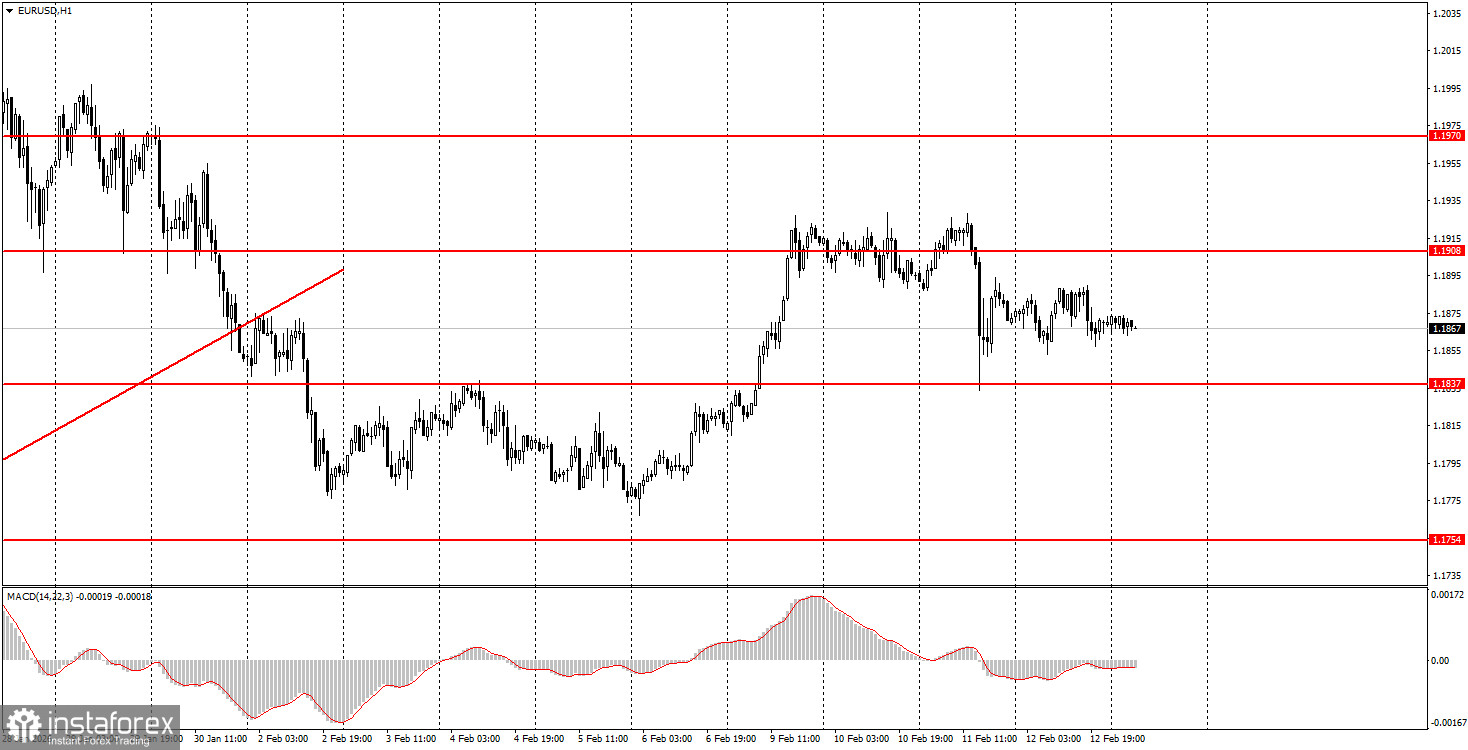
The EUR/USD currency pair traded with minimal volatility and exclusively sideways on Thursday. It seems that the market has yet to recover from the macroeconomic data released on Wednesday. Recall that on that day, the unemployment rate in the U.S. decreased to 4.3%, and Non-Farm Payrolls rose to 130,000 in January. At the same time, the Non-Farm value for the entire year of 2025 was revised downwards by nearly half a million jobs, revealing that the American economy created an average of only 19,000 jobs per month last year. In our view, this was yet another reason the dollar hit bottom. Trust in American data diminishes each week because the figures indicate one thing, while objective reality suggests something entirely different. In any case, the dollar maintained its position, the market ignored another set of weak American reports, and determining the trend on the hourly time frame is now challenging.

5M Chart of the EUR/USD Pair

Exchange Rates 13.02.2026 analysis

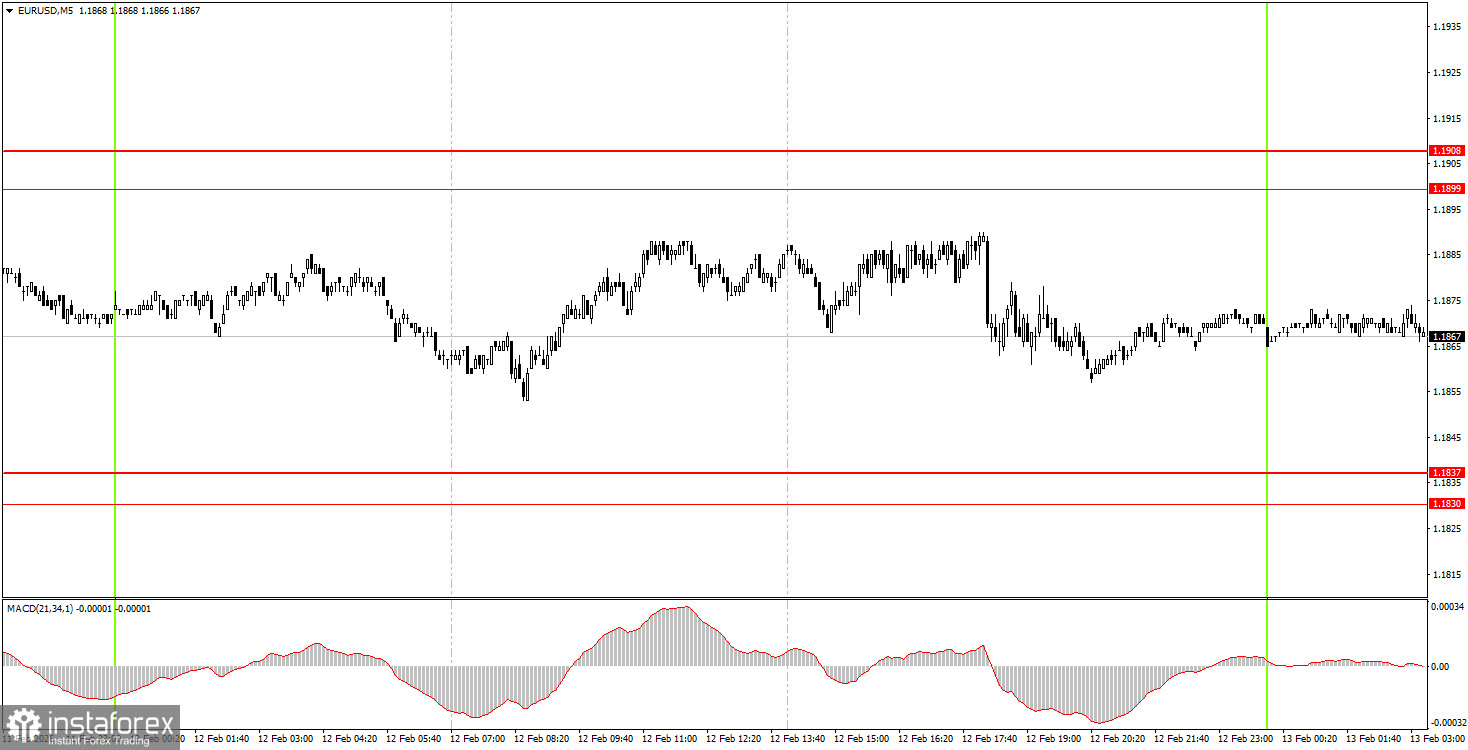
On the 5-minute time frame, there were no formed trading signals on Thursday. Throughout the day, the pair moved only sideways and did not approach any levels. Therefore, beginner traders had no basis for opening positions.

How to Trade on Friday:

On the hourly time frame, a downward correction is in place, which may soon revert to an upward trend. Recall that the flat movement that lasted for 7 months has ended. If that is the case, a long-term upward trend has resumed at the beginning of 2026. Thus, we anticipate a new medium-term decline of the dollar. The overall fundamental background remains very challenging for the American currency, so we fully support further movement to the upside.

On Friday, beginner traders may consider short positions if the price consolidates below the 1.1830-1.1837 area or if it bounces from the 1.1899-1.1908 area. A consolidation above the area of 1.1899-1.1908 or a bounce from the area of 1.1830-1.1837 will allow for opening long positions with a target of 1.1970.

On the 5-minute time frame, levels to consider are 1.1455-1.1474, 1.1527-1.1531, 1.1550, 1.1584-1.1591, 1.1655-1.1666, 1.1745-1.1754, 1.1830-1.1837, 1.1899-1.1908, 1.1970-1.1988, 1.2044-1.2056, 1.2092-1.2104. No significant events are scheduled in the European Union today. At the same time, the U.S. will release the third important report of the week, which the market may be anticipating: the inflation report.

Main Rules of the Trading System:

  1. The strength of the signal is determined by the time it takes to form (rebound or breaking through the level). The shorter the time, the stronger the signal.
  2. If two or more trades were opened around a particular level based on false signals, all subsequent signals from that level should be ignored.
  3. In a flat market, any pair can generate numerous false signals or no signals at all. In any case, it is best to stop trading at the first signs of a flat.
  4. Trades are opened during the time period between the start of the European session and until the middle of the American session, after which all trades should be manually closed.
  5. On the hourly timeframe, signals from the MACD indicator should ideally be traded only when there is good volatility and a trend confirmed by a trend line or channel.
  6. If two levels are too close to each other (ranging from 5 to 20 pips), they should be considered as a support or resistance area.
  7. After moving 15 pips in the correct direction, it is advisable to set the Stop Loss to break-even.

What's on the Charts:

  • Support and resistance levels are targets for opening buy or sell trades. Take Profit levels can be placed around them.
  • Red lines indicate channels or trend lines that reflect the current trend and indicate the preferred direction for trading now.
  • The MACD indicator (14,22,3) – the histogram and signal line – serves as a supplementary indicator that can also be used as a source of signals.
  • Important speeches and reports (always found in the news calendar) can significantly influence the movement of the currency pair. Therefore, during their release, trading should be conducted with maximum caution, or it is advised to exit the market to avoid a sharp price reversal against the preceding movement.
  • Beginners trading in the Forex market should remember that not every trade can be profitable. Developing a clear strategy and practicing sound money management are the keys to long-term trading success.
Paolo Greco
Analytical expert of InstaForex
© 2007-2026

Open trading account

InstaForex analytical reviews will make you fully aware of market trends! Being an InstaForex client, you are provided with a large number of free services for efficient trading.


Teraz opúšťate stránku www.instaforex.eu, ktorá patrí spoločnosti INSTANT TRADING EU LTD
Can't speak right now?
Ask your question in the chat.
Widget callback

Turn "Do Not Track" off