 Zostať
Podmienky obchodovania
Nástroje


The GBP/USD currency pair continued its corrective movement on Friday after breaking out of the descending trend line on Monday. The price could not consolidate below the critical line, nor could it rise above the Senkou Span B line. The technical picture for the pound is almost identical to that of the euro currency. To restore an upward trend on the hourly timeframe, the price must consolidate above the Senkou Span B line. For the upward trend to be canceled before it has even really begun, the price needs to move below the critical line at the very least.
As for the macroeconomic background, in our opinion, the dollar had every reason to decline sharply last week. We believe that the annual Non-farm Payrolls are more important than those for January, and the labor market still requires support. We think that the inflation slowdown to 2.4% opens up "dovish" prospects for the Fed. Inflation in the U.S. may not continue to slow in the coming months, but its current level is not high enough to warrant aggressive monetary policy. Thus, the market is currently in a pause, and we need to wait for it to complete.
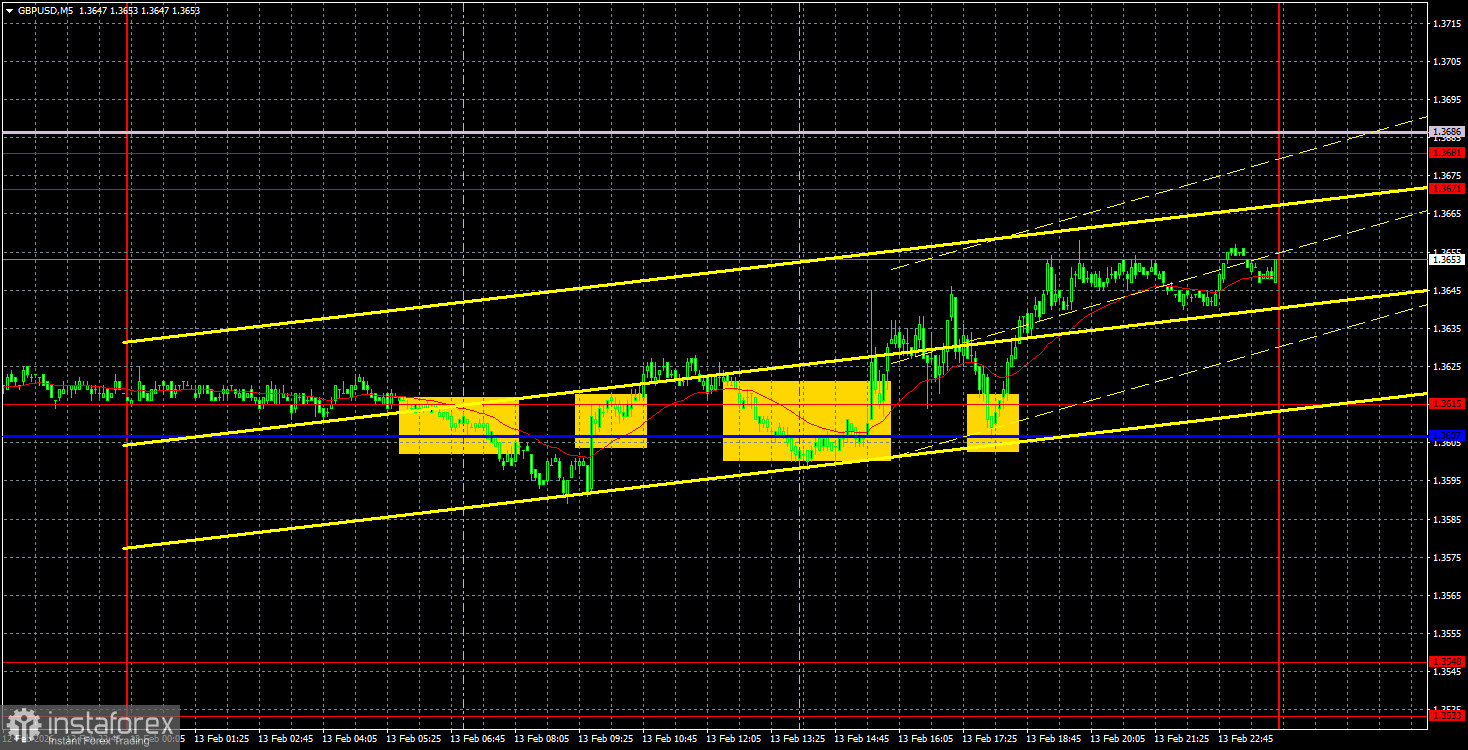
On the 5-minute timeframe, one sell signal and three buy signals were formed on Friday. All were in the area of 1.3607-1.3615. The first sell signal proved false, while the next three buy signals duplicated each other, allowing only one long position to be opened. By the end of the day, the British pound had indeed risen by about 25 pips.
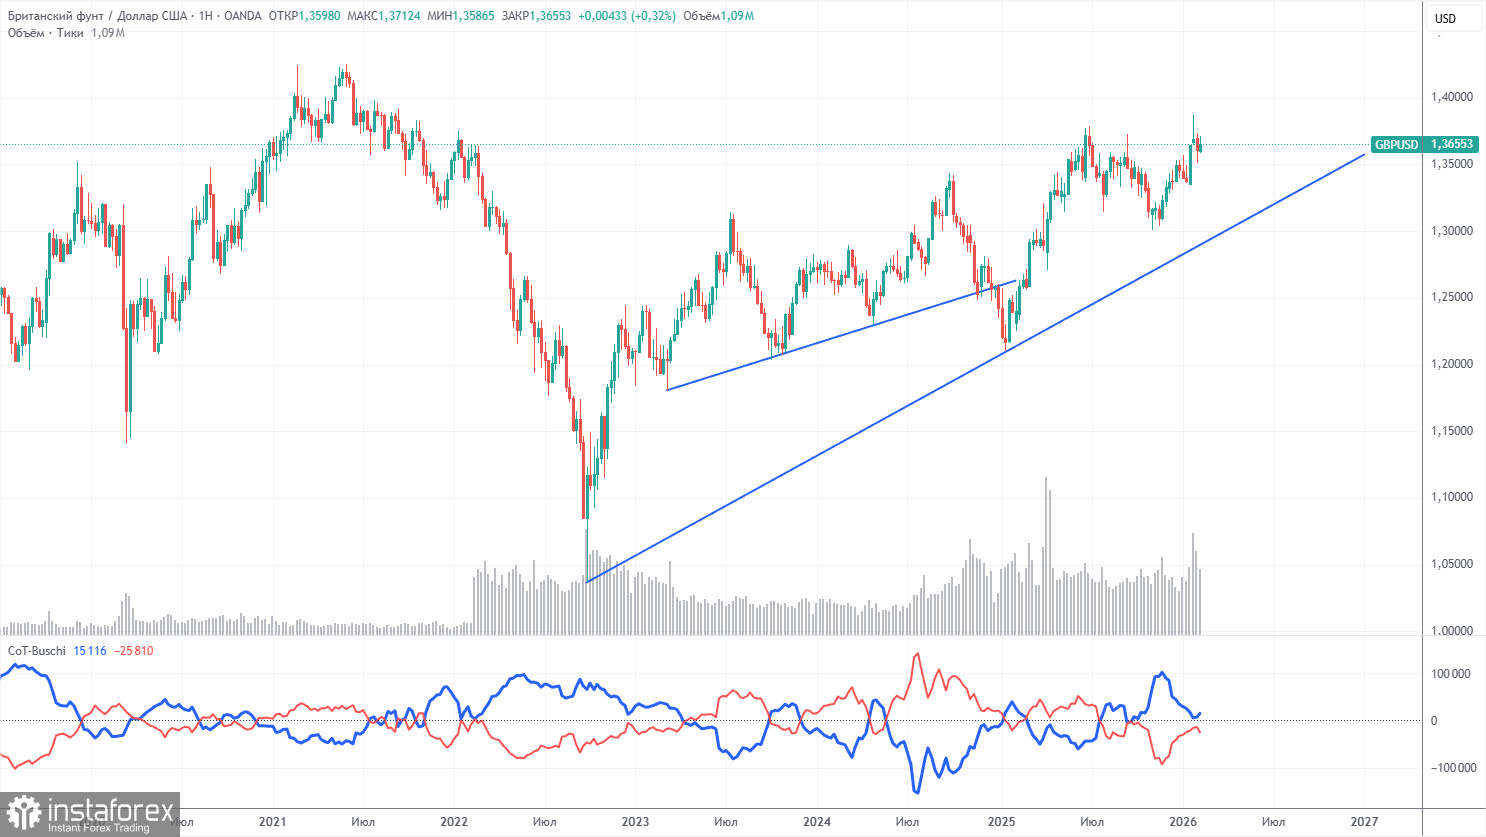
The COT reports for the British pound show that commercial traders' sentiment has been changing frequently in recent years. The red and blue lines representing the net positions of commercial and non-commercial traders frequently cross and are usually located close to the zero mark. Currently, the lines are approaching each other, but non-commercial traders still dominate with... sales. Recently, speculators have been actively increasing long positions, so a shift in sentiment may soon occur, which does not greatly affect the GBP/USD pair.
The dollar continues to decline due to Donald Trump's policy, as shown clearly on the weekly timeframe (illustration above). The trade war will continue in one form or another for a long time, and the Fed will, in any case, lower rates in the next 12 months. The demand for the dollar will fall in one way or another. According to the latest COT report (as of February 10) for the British pound, the "Non-commercial" group closed 6,500 BUY contracts and opened 5,300 SELL contracts. Thus, the net position of non-commercial traders decreased by 11,800 contracts over the week.
In 2025, the pound rose significantly, but it should be understood that there is only one reason: Trump's policy. Once this reason is nullified, the dollar may start to rise. But no one knows when this will happen.
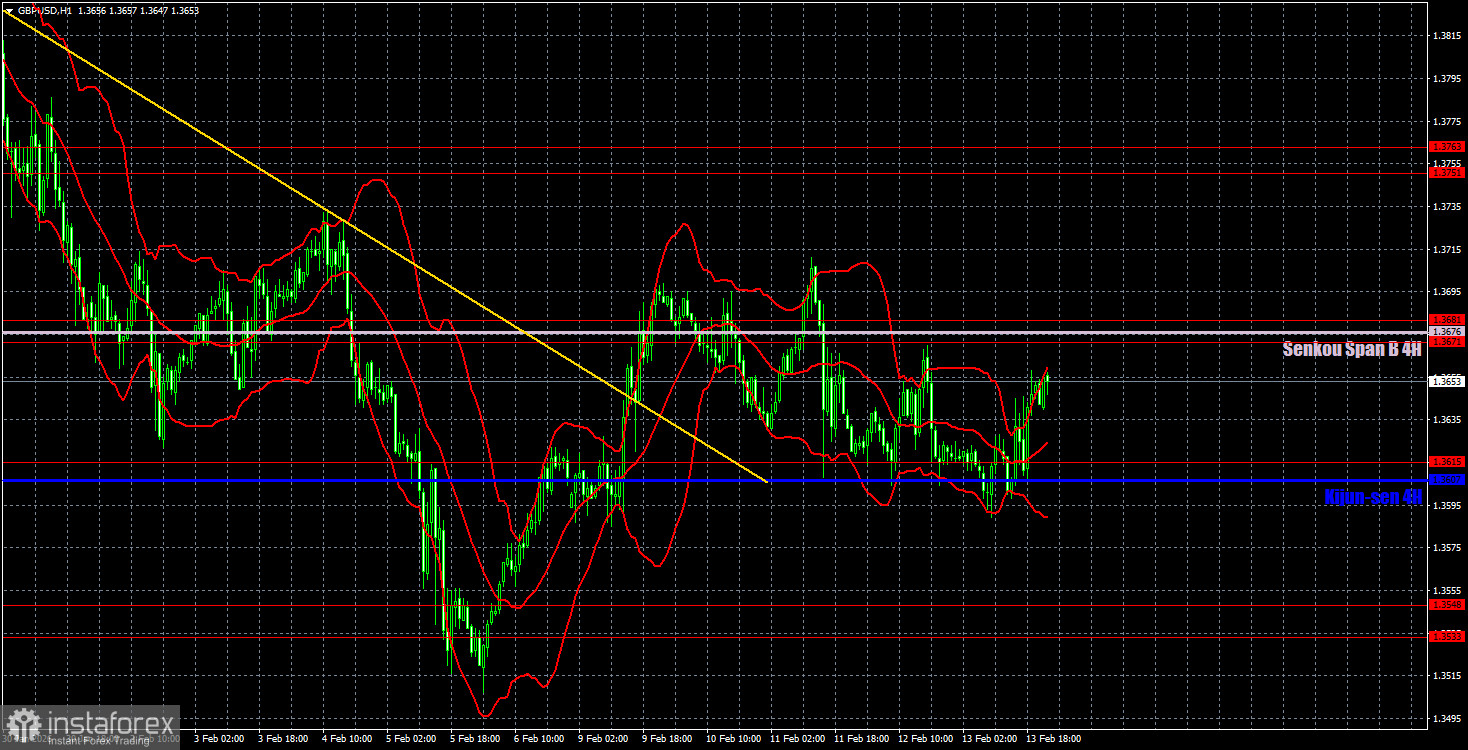
On the hourly timeframe, the GBP/USD pair has broken the downward trend, so an increase can be expected in the short term. Certain events are hindering the British currency's growth or supporting the dollar. This is inevitable. The price cannot always move in one direction. We still believe that, in the medium term, the British pound will rise amid the decline of the American currency. Thus, local upward trends have a higher priority than downward ones.
For February 16, we highlight the following important levels: 1.3201-1.3212, 1.3307, 1.3369-1.3377, 1.3437, 1.3533-1.3548, 1.3615, 1.3671-1.3681, 1.3751-1.3763, 1.3846-1.3886, 1.3948. The Senkou Span B (1.3676) and Kijun-sen (1.3607) lines can also be sources of signals. It is recommended to set the Stop Loss level to break-even if the price moves 20 pips in the correct direction. The Ichimoku indicator lines may move throughout the day, which should be taken into account when determining trading signals.
On Monday, there are no significant events scheduled in the UK. The macroeconomic calendar is also empty in the United States. Thus, traders will have nothing to react to today. Most likely, volatility will be low during the day unless Donald Trump delivers devastating news.
Today, traders can consider short positions with a target of 1.3607-1.3615 if the price bounces off the 1.3671-1.3681 area. Long positions will become relevant with a target of 1.3751-1.3763 if the price breaks through the area of 1.3671-1.3681.
Support and resistance price levels – thick red lines around which the movement may end. They are not sources of trading signals.
Kijun-sen and Senkou Span B lines – lines of the Ichimoku indicator transferred to the hourly timeframe from the 4-hour timeframe. They are strong lines.
Extreme levels – thin red lines from which the price has previously bounced. They are sources of trading signals.
Yellow lines – trend lines, trend channels, and any other technical patterns.
Indicator 1 on COT charts – the size of the net position of each category of traders.
InstaForex analytical reviews will make you fully aware of market trends! Being an InstaForex client, you are provided with a large number of free services for efficient trading.


