 Zostať
Podmienky obchodovania
Nástroje


Bitcoin sharply bounced back after exiting a sideways channel and returned inside it. Thus, we are indeed talking about a deviation at the channel's lower boundary, which presented an unpleasant scenario for traders. Deviations can be quite deep and prolonged, but such patterns offer no value for traders, as it remains unclear whether we are dealing with a liquidity grab or the end of a flat trend. Therefore, it was practically impossible to capitalize on the deviation that formed this week. Since the price has returned to the sideways channel, the flat trend continues. All internal patterns again lack significance. We need to wait for new signals.
It is also worth noting that, for the first time in a long while, a "bullish" FVG pattern formed on the daily timeframe following a sharp rise. Theoretically, traders can make purchases based on this, but the strong downward trend is clearly visible on the same daily timeframe. Of course, this trend will end sooner or later, so we cannot prohibit anyone from buying Bitcoin. However, under current circumstances, purchases might logically be of smaller volume than sales. In any case, the flat trend remains on the 4-hour timeframe, which currently holds priority.
Meanwhile, independent analysts and traders continue to expect further declines in the first cryptocurrency. Many of them note that in the past, each bullish Bitcoin cycle ended with a decline of 70-80%. Contrary to popular belief among "experts," large players are currently offloading Bitcoin. The levels at which new mass purchases will start are definitely below $50,000.
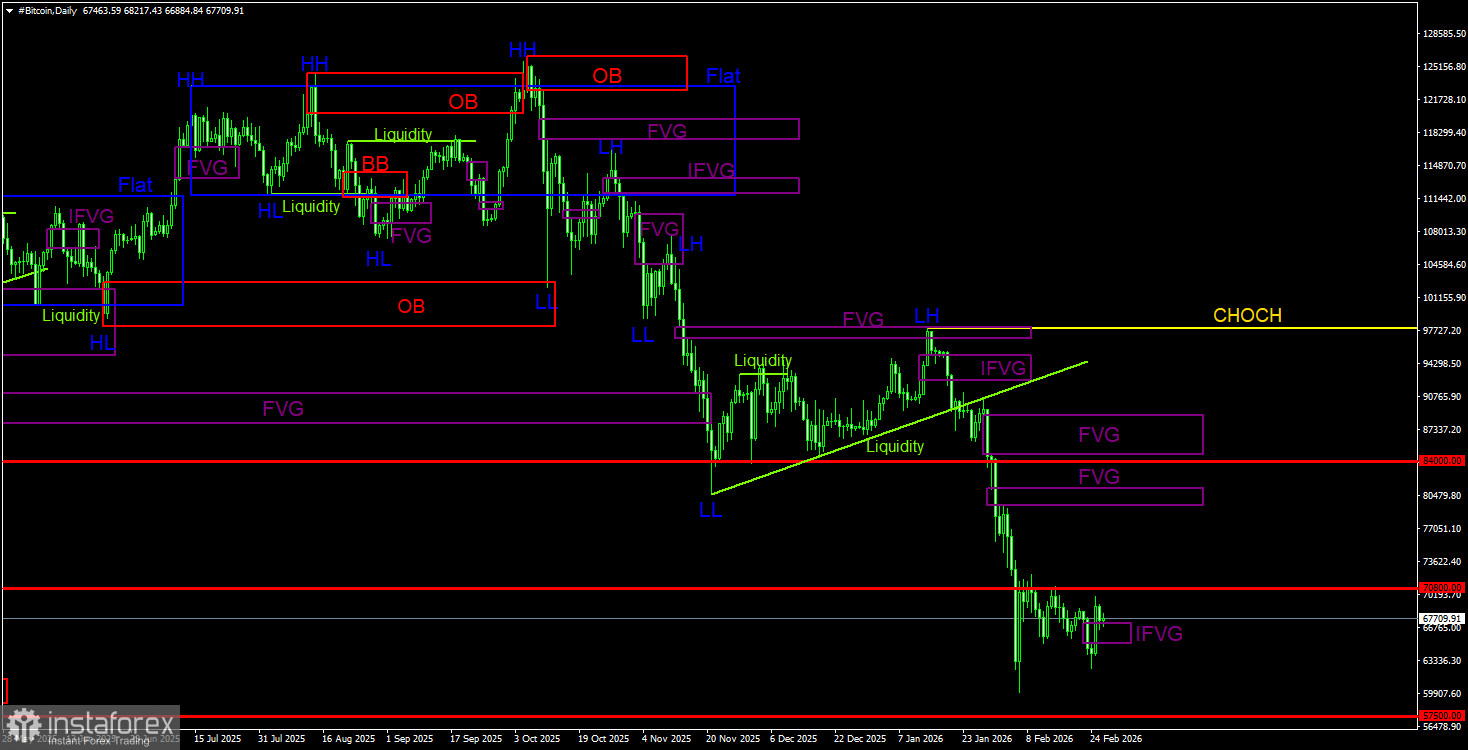
On the daily timeframe, Bitcoin continues to form a downward trend. The trend structure is identified as descending, and the CHOCH line currently sits at $97,900. Only above this level can we say that the downward trend has ended. Recall that a sell signal was formed within the "bearish" FVG ($96,900 – $98,000) and received confirmation on the lower timeframe. Thus, traders had a great opportunity to capture almost all of the recent downward movement. The current target remains at the level of $57,500 – 61.8% Fibonacci. Given the lack of signs of a reversal, we believe the decline will continue. On the daily timeframe, the nearest area of interest (POI) for new sell trades is in the range of $79,500 – $81,100. This week, a bearish FVG was formed, which turned into a bullish IFVG. However, the flat trend persists on the 4-hour timeframe.
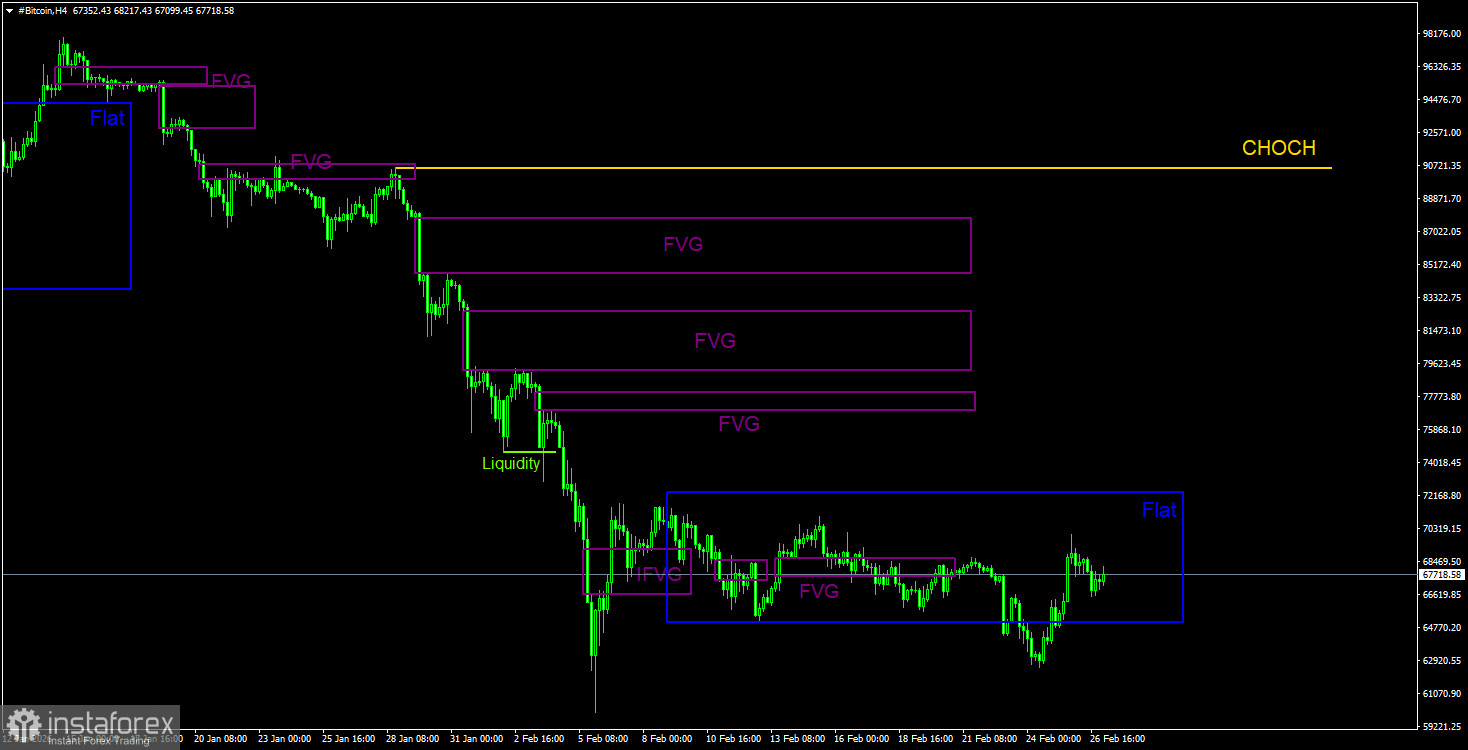
On the 4-hour timeframe, the price continues to form a downward structure as well. The CHOCH line is at $90,560; only above this line can we speak of a trend shift to an upward one. However, at this point, there are no signs indicating that Bitcoin might end its decline anytime soon. The flat continues. There has been a poorly formed deviation at the lower boundary of the sideways channel. Since the price is again within the flat, one should continue to monitor the formation of deviations.
Bitcoin continues to form a full-fledged downward trend. We anticipate a decline targeting $57,500 (the 61.8% level of the Fibonacci from the three-year upward trend), and there are currently no signs of a trend reversal. However, even the $57,500 level no longer looks like a final stop. Among the areas of interest (POI) currently, we can only highlight the bullish IFVG on the daily timeframe, but this is a corrective pattern. A reaction to it could lead to a rise in Bitcoin, but the key technical pattern right now is the flat on the 4-hour timeframe. Therefore, deviations at the boundaries of the sideways channel should be monitored closely.
CHOCH – Change of character in the trend structure.
Liquidity – Stop Loss liquidity of traders, which market makers use to build their positions.
FVG – Fair Value Gap. Price moves very quickly through such areas, indicating a complete absence of one side in the market. Subsequently, the price tends to return to and react at these areas.
IFVG – Inverted Fair Value Gap. After a return to such an area, the price does not react to it but impulsively breaks through, then tests it from the other side.
OB – Order Block. A candle in which the market maker opened a position aimed at extracting liquidity to form a position in the opposite direction.
InstaForex analytical reviews will make you fully aware of market trends! Being an InstaForex client, you are provided with a large number of free services for efficient trading.


