 Zostať
Podmienky obchodovania
Nástroje


The GBP/USD pair also traded higher throughout Wednesday, not driven by macroeconomic conditions or fundamental events. The recent upward movement in the pair is exclusively a response to the market's positive expectations for the imminent end of the war in Iran, spurred by Donald Trump and Masoud Pezeshkian. There are no real signs of de-escalation in the conflict in the Middle East, and this remains unchanged. Yesterday, three reports were published in the US, each of which supported the US dollar. Retail sales grew more than expected, the number of new private sector jobs in the ADP exceeded forecasts by 20,000, and the ISM Manufacturing PMI came in at 52.7 points against forecasts of 52-52.5. Thus, the dollar could have strengthened even yesterday if traders had paid any attention to the macroeconomic backdrop. However, it rose last night when Donald Trump gave another speech, which was even noted in event calendars. It is interesting to wonder why, considering that the American president gives interviews about five times a day. Nevertheless, Trump did not provide any signals regarding the imminent end of the war and an agreement with Iran. The market responded by buying dollars.
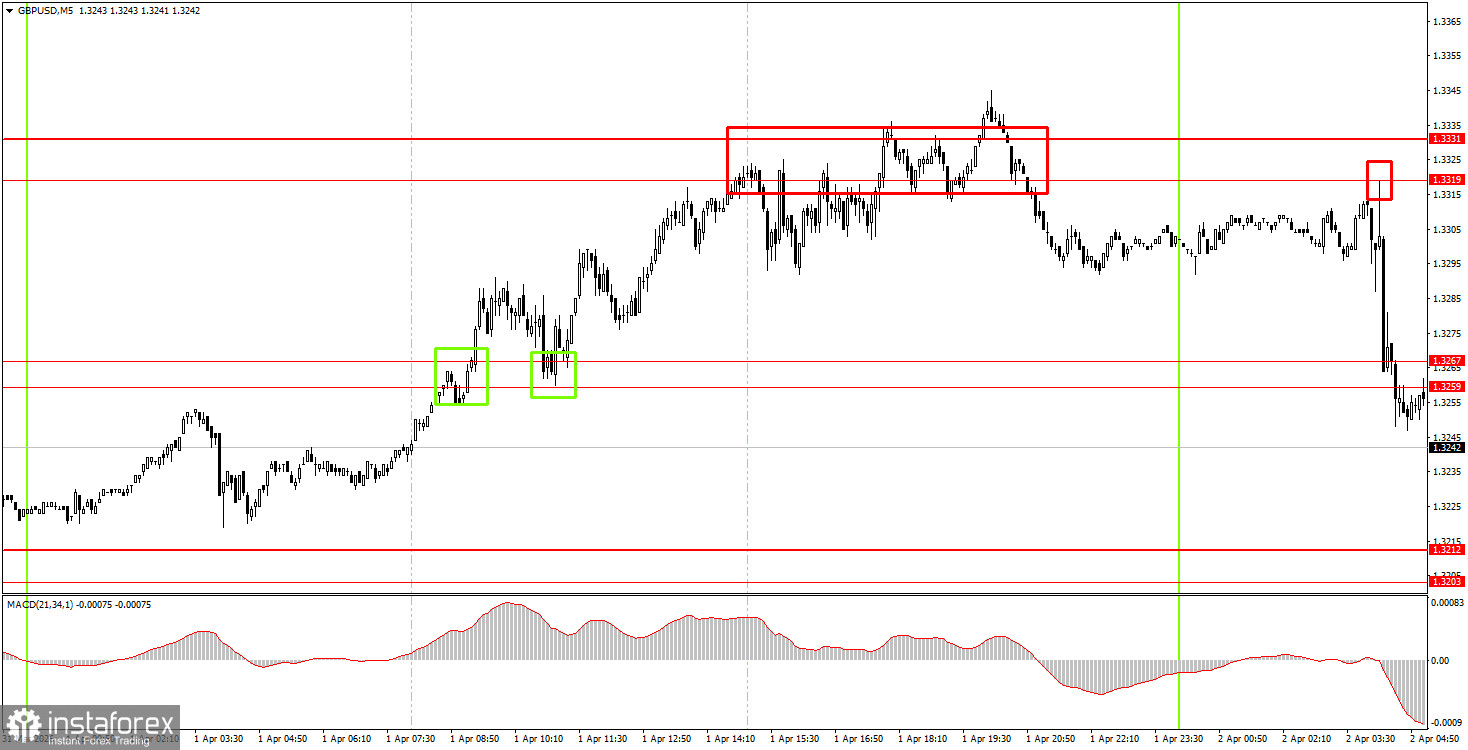
On the 5-minute timeframe on Wednesday, two buy signals were formed during the European trading session in the area of 1.3259-1.3267. A few hours later, the nearest target was hit – the area of 1.3319-1.3331. In this area, several sell signals were generated, and last night the pair collapsed, racing toward the 1.3203-1.3212 area. As a result, both trades were profitable.
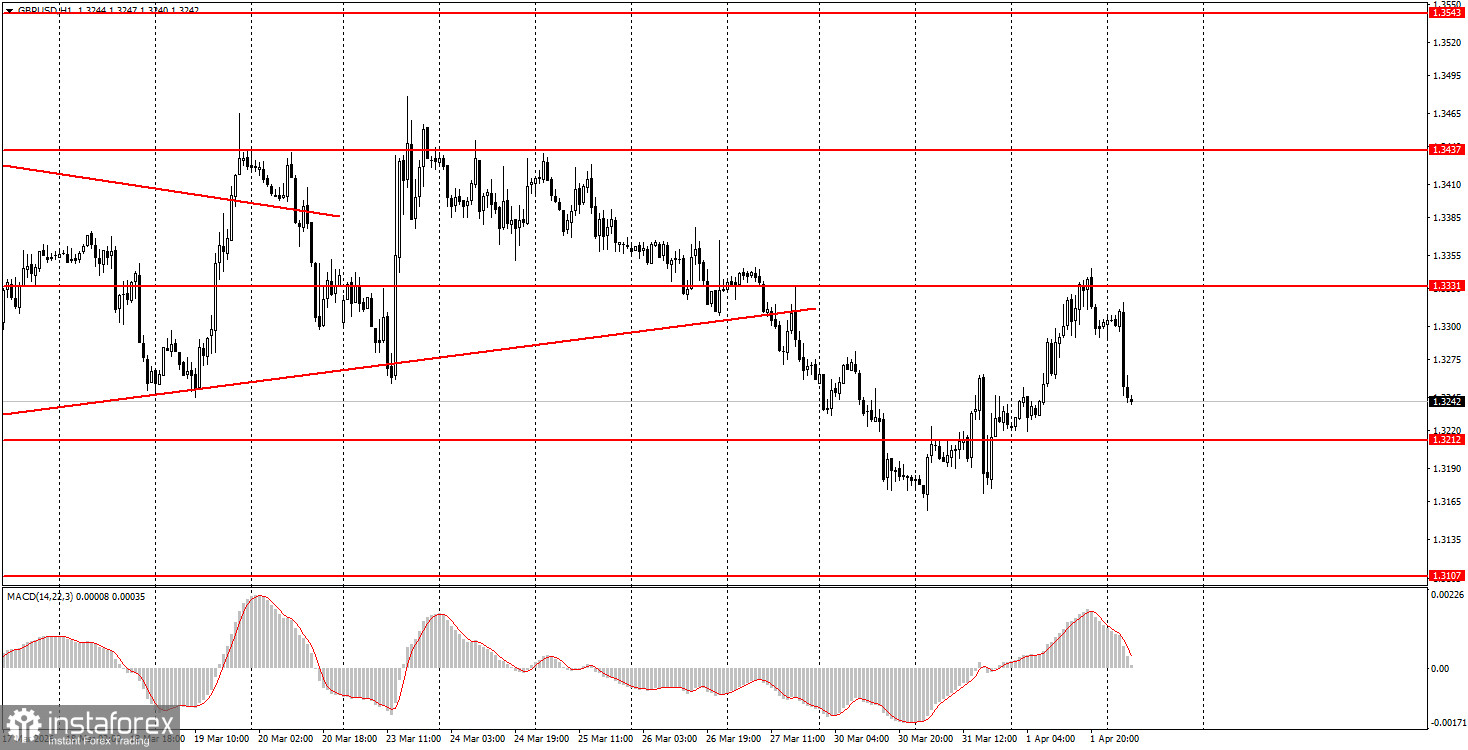
On the hourly timeframe, the GBP/USD pair's latest upward trend has been broken. There are no global reasons for a medium-term rise in the dollar, so we expect the revival of the global upward trend from 2025 in 2026. However, for this to happen, geopolitical tensions around the world need to start easing, as the dollar is currently in demand solely based on geopolitics.
On Thursday, beginner traders may open new short positions if the price consolidates below the 1.3203-1.3212 range, targeting 1.3096-1.3107. Consolidation above the area of 1.3259-1.3267 or a bounce from the area of 1.3203-1.3212 will allow for long positions.
On the 5-minute timeframe, trading levels to consider include: 1.3096-1.3107, 1.3203-1.3212, 1.3259-1.3267, 1.3319-1.3331, 1.3403-1.3407, 1.3437-1.3446, 1.3484-1.3489, 1.3529-1.3543, 1.3643-1.3652, 1.3695, and 1.3741-1.3751. There are no major events scheduled in the UK today, while in the US, only secondary unemployment claims will be released. The market will once again trade solely based on geopolitical news.
Price levels of support and resistance are levels that serve as targets when opening buys or sells. Take Profit levels can be placed around them.
Red lines represent channels or trend lines that show the current trend and indicate the direction in which it is preferable to trade now.
The MACD indicator (14,22,3) – the histogram and the signal line – is a supporting indicator that can also be used as a source of signals.
Important speeches and reports (always included in the news calendar) can significantly affect the movement of the currency pair. Therefore, during their release, trading should be done with utmost caution, or traders should exit the market to avoid sharp price reversals against the previous movement.
Beginning traders in the forex market should remember that not every trade can be profitable. Developing a clear strategy and effective money management are the keys to long-term trading success.
InstaForex analytical reviews will make you fully aware of market trends! Being an InstaForex client, you are provided with a large number of free services for efficient trading.


