 Zostať
Podmienky obchodovania
Nástroje


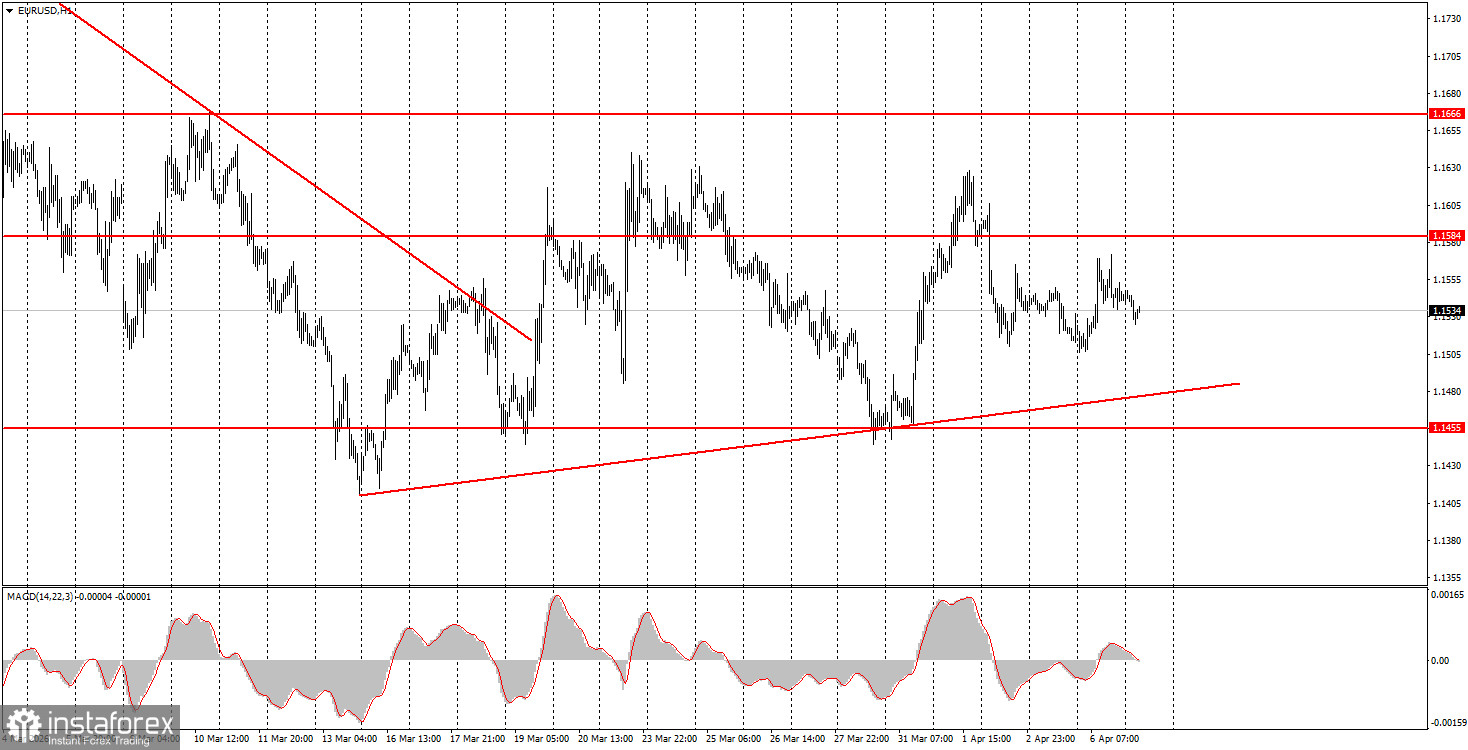
The EUR/USD currency pair traded mixed on Monday, driven neither by geopolitics, fundamentals, nor macroeconomics. The only report of the day—the ISM Services Index in the US—was ignored by traders, which no one found surprising. The US did not deliver the promised strike against Iran, as Donald Trump postponed the deadline for negotiations regarding the reopening of the Strait of Hormuz for the third time to today. The market continues to anticipate new escalations in the Middle East, remaining tense, and the European currency still cannot establish any upward trend. Thus, the technical picture for Monday remained unchanged. We still observe the formation of a formal upward trend, while all movements of the pair depend on geopolitical events.
On the hourly timeframe, the upward trend remains relevant due to the adjustment of the trend line; however, it is merely formal, as no one is currently paying attention to technical analysis. The market continues to trade solely based on geopolitics and emotions. Therefore, the "roller coaster" may continue for a long time, and macroeconomic, technical, and fundamental factors are of little significance. Trump continually provokes both crashes and surges in the US dollar.
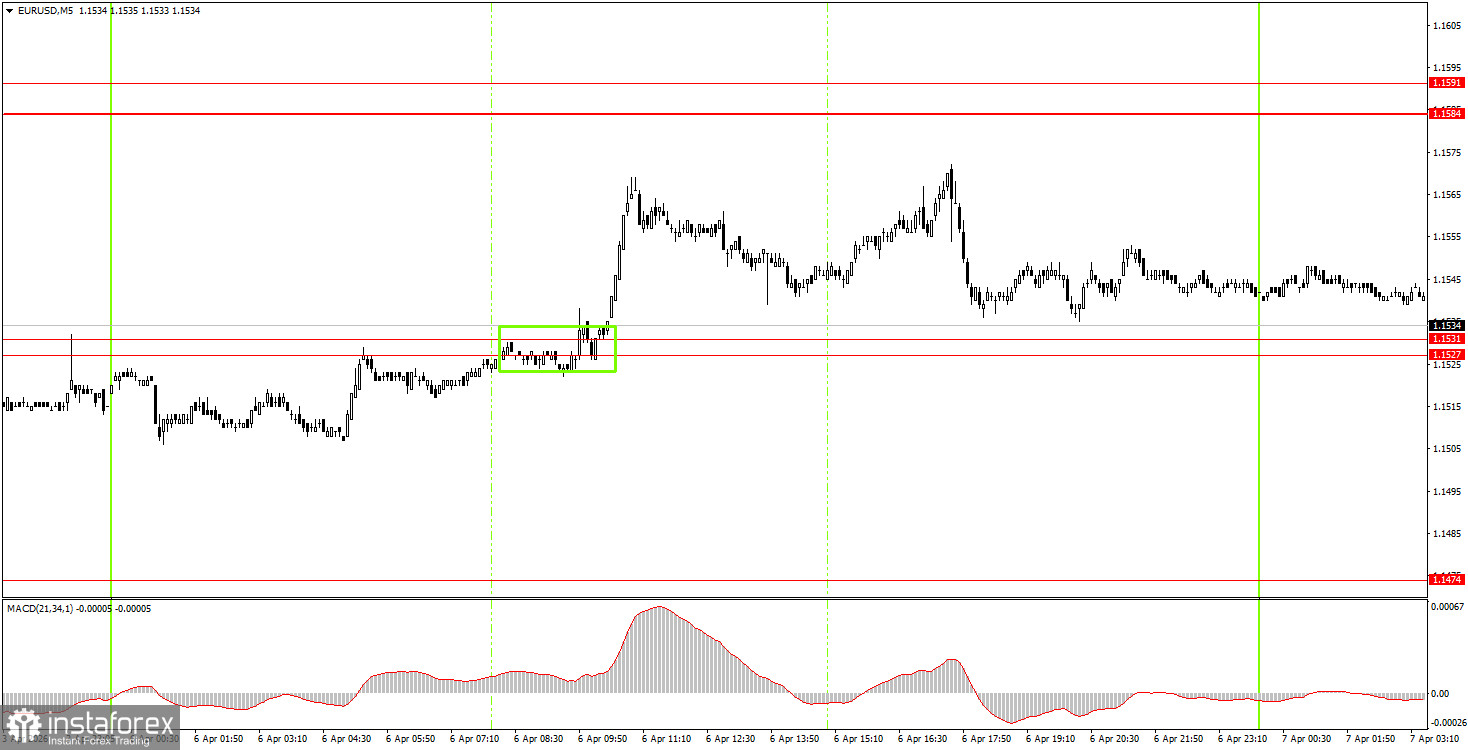
On Tuesday, beginner traders may consider opening short positions if the price consolidates below the 1.1527-1.1531 area, targeting 1.1455-1.1474. A bounce from the area of 1.1527-1.1531 will allow for long positions with a target of 1.1584-1.1591.
On the 5-minute timeframe, levels to trade now include: 1.1267-1.1292, 1.1354-1.1363, 1.1413, 1.1455-1.1474, 1.1527-1.1531, 1.1584-1.1591, 1.1655-1.1666, 1.1745-1.1754, 1.1830-1.1837, and 1.1899-1.1908. On Tuesday, the US durable goods orders report will be published, which is considered quite important. However, we have little doubt that this report will also be ignored. This evening, the US may carry out the promised strike on Iran, so market attention will again be fully focused on geopolitics.
Price levels of support and resistance are levels that serve as targets when opening buys or sells. Take Profit levels can be placed around them.
Red lines represent channels or trend lines that show the current trend and indicate the direction in which it is preferable to trade now.
The MACD indicator (14,22,3) – the histogram and the signal line – is a supporting indicator that can also be used as a source of signals.
Important speeches and reports (always included in the news calendar) can significantly affect the movement of the currency pair. Therefore, during their release, trading should be done with utmost caution, or traders should exit the market to avoid sharp price reversals against the previous movement.
Beginning traders in the forex market should remember that not every trade can be profitable. Developing a clear strategy and effective money management are the keys to long-term trading success.
InstaForex analytical reviews will make you fully aware of market trends! Being an InstaForex client, you are provided with a large number of free services for efficient trading.


