 Zostať
Podmienky obchodovania
Nástroje


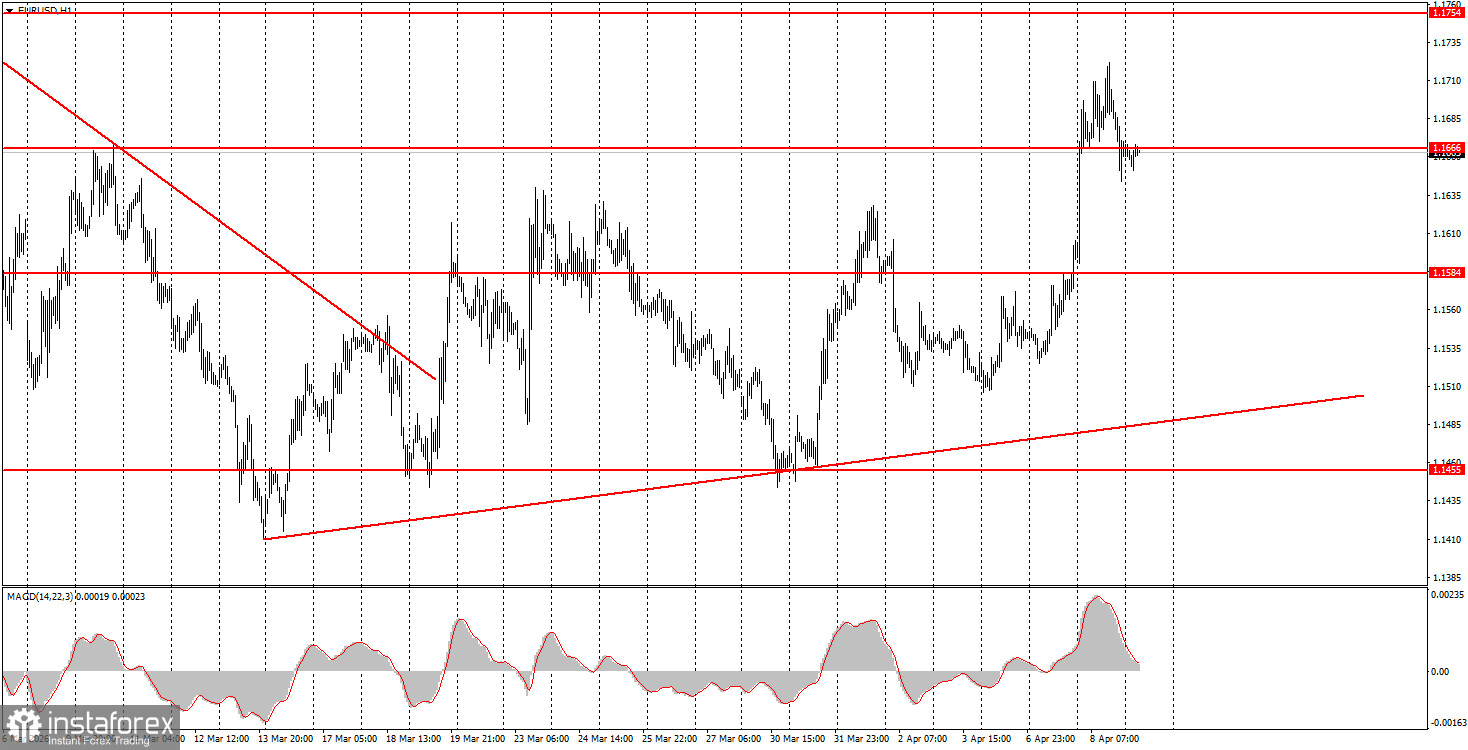
The EUR/USD currency pair achieved strong upward movement on Wednesday, but most of it occurred during the Asian trading session. Recall that Donald Trump unexpectedly announced a two-week ceasefire agreement with Iran, which triggered a sharp decline in both the dollar and oil prices. However, during the day, Israel launched hundreds of rockets at Lebanon, while Iran struck Bahrain and Kuwait. Thus, the ceasefire appears rather dubious, and there have been no new statements from Donald Trump regarding the current situation in the Middle East. Therefore, today, traders are likely to hesitate before making new dollar sales, as the truce currently seems quite ephemeral. Nonetheless, a new complex upward trend has begun to form on the hourly time frame, but the pair's further growth depends entirely on geopolitics. If it turns out today that the ceasefire has ended, the pair could fall back to the trend line.
On the hourly time frame, the upward trend has resumed due to geopolitics, and the pair's further movements will depend on the same factors. The market continues to trade exclusively based on events in the Middle East and emotions. Therefore, the "rollercoaster" effect may continue for a long time, while macroeconomic, technical, and fundamental factors become irrelevant. Trump consistently provokes both declines and surges in the U.S. dollar.
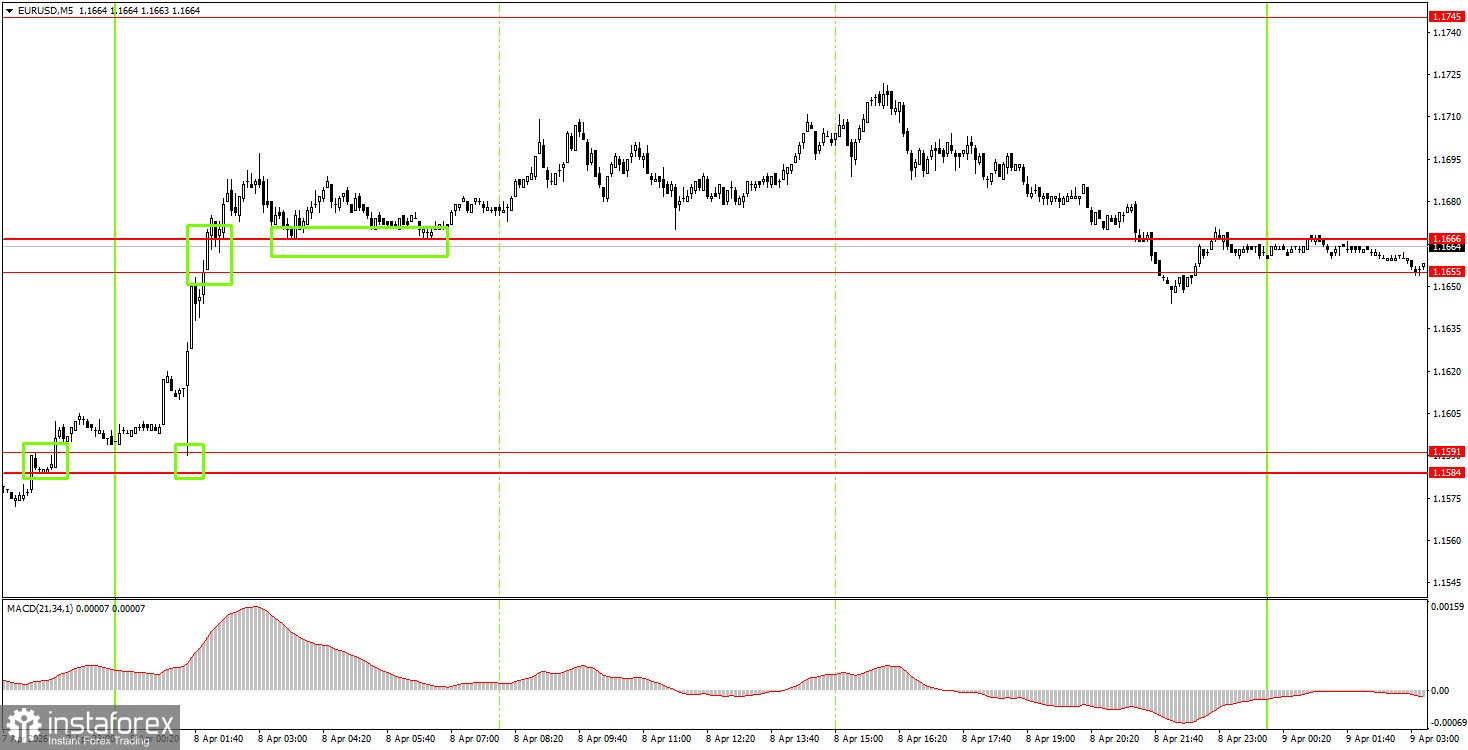
On Thursday, beginner traders may consider short positions if the price consolidates below the 1.1655-1.1666 area, targeting 1.1584-1.1591. A price bounce from the area of 1.1655-1.1666 will allow for long positions to be opened with targets at 1.1745-1.1754.
On the 5-minute time frame, levels to consider include 1.1267-1.1292, 1.1354-1.1363, 1.1413, 1.1455-1.1474, 1.1527-1.1531, 1.1584-1.1591, 1.1655-1.1666, 1.1745-1.1754, 1.1830-1.1837, 1.1899-1.1908. On Thursday, the U.S. will publish the third estimate of fourth-quarter GDP, as well as the core personal consumption expenditure index. Meanwhile, Germany will release its industrial production report. We believe the markets will again be awaiting news from Trump regarding the ceasefire with Iran.
Price levels of support and resistance are levels that serve as targets when opening buys or sells. Take Profit levels can be placed around them.
Red lines represent channels or trend lines that show the current trend and indicate the direction in which it is preferable to trade now.
The MACD indicator (14,22,3) – the histogram and the signal line – is a supporting indicator that can also be used as a source of signals.
Important speeches and reports (always included in the news calendar) can significantly affect the movement of the currency pair. Therefore, during their release, trading should be done with utmost caution, or traders should exit the market to avoid sharp price reversals against the previous movement.
Beginning traders in the forex market should remember that not every trade can be profitable. Developing a clear strategy and effective money management are the keys to long-term trading success.
InstaForex analytical reviews will make you fully aware of market trends! Being an InstaForex client, you are provided with a large number of free services for efficient trading.


