 Zostať
Podmienky obchodovania
Nástroje


The GBP/USD pair also demonstrated strong growth on Wednesday, but, like the euro, most of the upward movement occurred during the Asian trading session. During the European and American sessions, information began to emerge indicating that the ceasefire is not a true ceasefire, as no one intends to end hostilities in the Middle East. For example, Israel reported that an agreement has only been reached with Iran, while Lebanon is still not included in the list of friendly countries. Thus, we saw the market's initial reaction to the negotiations and a potential peace, but now, for further growth of the pair, confirmation is needed that all conflict participants in the Middle East are ready to cease fire and sit down at the negotiating table.
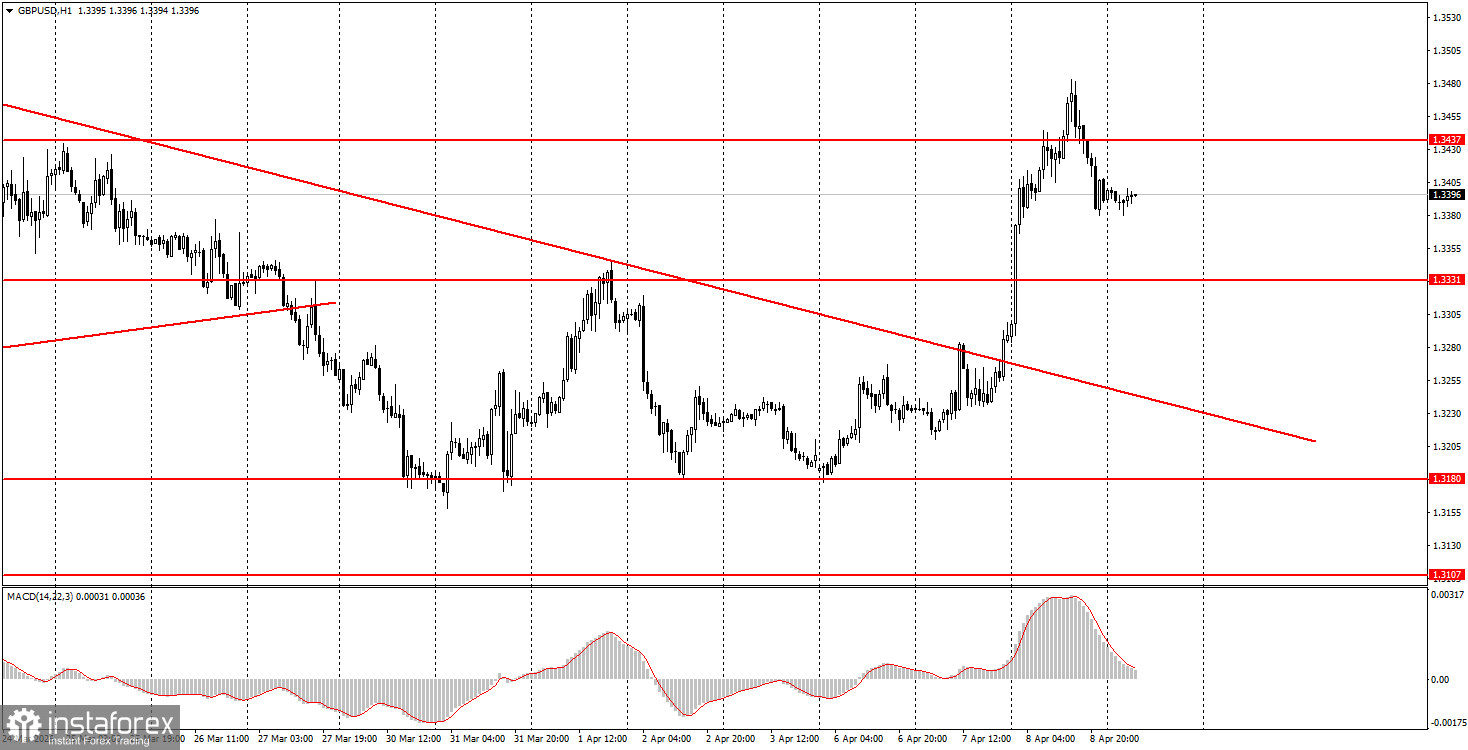
From a technical standpoint, the descending trendline has been breached, but the further growth of the British pound depends on how long and successful the ceasefire proves to be.

On the 5-minute time frame, a multitude of trading signals were formed on Wednesday. Throughout the day, the pair consistently bounced from one of three zones: 1.3403-1.3407, 1.3437-1.3446, and 1.3484-1.3489. All signals generated during the day resulted in hitting target areas. As a result, beginner traders opened many trading positions, all of which turned out to be profitable.
On the hourly time frame, the GBP/USD pair has begun to form a new upward trend, but the British pound's growth will depend entirely on the degree of de-escalation in the Middle East. There are no global grounds for medium-term dollar growth, so we expect the global upward trend to resume in 2026. However, for that to happen, geopolitical tensions worldwide must continue to decline, as the dollar has been in demand solely on that basis.
On Thursday, beginner traders may open new short positions if the price bounces from the 1.3403-1.3407 area, targeting 1.3319-1.3331. A consolidation above the 1.3403-1.3407 area will allow opening long positions with targets at 1.3437-1.3446 and 1.3484-1.3489.
On the 5-minute time frame, trading can currently be executed at the levels of 1.3096-1.3107, 1.3175-1.3180, 1.3259-1.3267, 1.3319-1.3331, 1.3403-1.3407, 1.3437-1.3446, 1.3484-1.3489, 1.3529-1.3543, 1.3643-1.3652, 1.3695, 1.3741-1.3751. Today, there are no major events scheduled in the UK, while in the U.S., the third estimate of fourth-quarter GDP and the core personal consumption expenditure (PCE) index will be released. We believe the market focus will again be directed toward geopolitics.
Price levels of support and resistance are levels that serve as targets when opening buys or sells. Take Profit levels can be placed around them.
Red lines represent channels or trend lines that show the current trend and indicate the direction in which it is preferable to trade now.
The MACD indicator (14,22,3) – the histogram and the signal line – is a supporting indicator that can also be used as a source of signals.
Important speeches and reports (always included in the news calendar) can significantly affect the movement of the currency pair. Therefore, during their release, trading should be done with utmost caution, or traders should exit the market to avoid sharp price reversals against the previous movement.
Beginning traders in the forex market should remember that not every trade can be profitable. Developing a clear strategy and effective money management are the keys to long-term trading success.
InstaForex analytical reviews will make you fully aware of market trends! Being an InstaForex client, you are provided with a large number of free services for efficient trading.


