 Zostať
Podmienky obchodovania
Nástroje


The GBP/USD pair attempted to extend its upward move on Thursday amid optimism about a potential ceasefire in the Middle East; however, during the day, traders realized there was no actual ceasefire. There are only negotiations and a violation of the two-week ceasefire that lasted less than a day. As such, the market is in no hurry to make new dollar purchases, yet reluctant to sell dollars. For any upward movement to continue, a more convincing and lasting format for the cessation of hostilities and the unlocking of the Strait of Hormuz is required. In the UK, there was no macroeconomic backdrop yesterday, while in the U.S., the core personal consumption expenditure index and the third estimate of fourth-quarter inflation were published. U.S. economic growth, as expected, disappointed even more than the previous two estimates, and the PCE index was brazenly ignored by the market, which is no surprise.
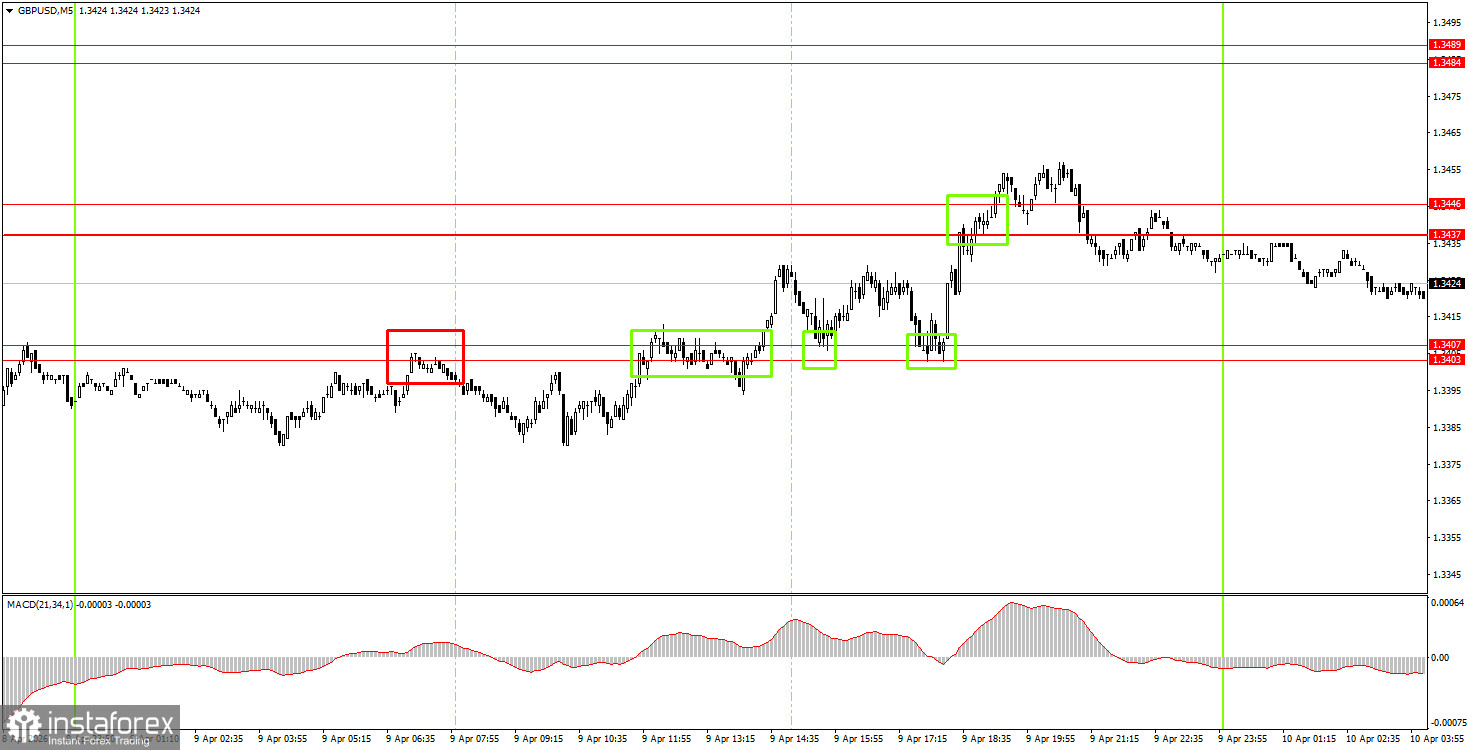
On the 5-minute time frame, five trading signals were formed on Thursday. The first sell signal in the area of 1.3403-1.3407 proved false, as the price failed to move in the desired direction by even 20 pips. The next three buy signals were more successful and effectively duplicated each other. However, in the end, the price did reach the nearest target of 1.3437-1.3446 and surpassed it. Although the upward movement did not continue, there was still an opportunity to profit from the last trade.
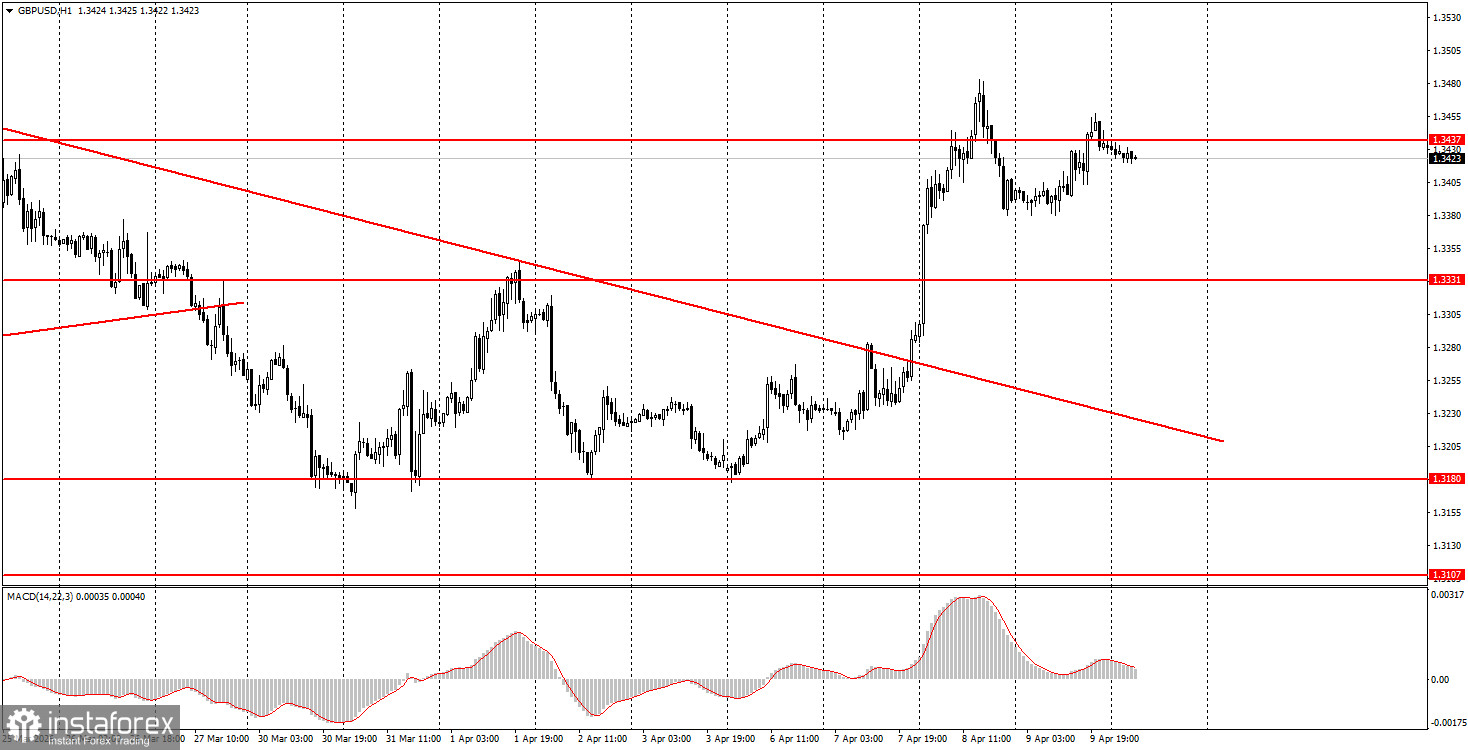
On the hourly time frame, the GBP/USD pair has begun to form a new upward trend; however, the British pound's growth will depend entirely on the degree of de-escalation in the Middle East. There are no global grounds for medium-term dollar growth, so in 2026, we expect the resumption of the global upward trend of 2025. However, this requires geopolitical tensions worldwide to continue to decline, as the dollar has been in demand solely on geopolitical grounds.
On Friday, beginner traders may open new short positions if the price bounces from the area of 1.3437-1.3446 or consolidates below the area of 1.3403-1.3407. A consolidation above the area of 1.3437-1.3446 or a bounce from 1.3403-1.3407 will allow for long positions to be opened.
On the 5-minute time frame, trading can currently be executed at the levels of 1.3096-1.3107, 1.3175-1.3180, 1.3259-1.3267, 1.3319-1.3331, 1.3403-1.3407, 1.3437-1.3446, 1.3484-1.3489, 1.3529-1.3543, 1.3643-1.3652, 1.3695, 1.3741-1.3751. Today, there are no major events planned in the UK, while in the U.S., the most important report of the week—on inflation—will be released. We do expect to see a market reaction to this report.
Price levels of support and resistance are levels that serve as targets when opening buys or sells. Take Profit levels can be placed around them.
Red lines represent channels or trend lines that show the current trend and indicate the direction in which it is preferable to trade now.
The MACD indicator (14,22,3) – the histogram and the signal line – is a supporting indicator that can also be used as a source of signals.
Important speeches and reports (always included in the news calendar) can significantly affect the movement of the currency pair. Therefore, during their release, trading should be done with utmost caution, or traders should exit the market to avoid sharp price reversals against the previous movement.
Beginning traders in the forex market should remember that not every trade can be profitable. Developing a clear strategy and effective money management are the keys to long-term trading success.
InstaForex analytical reviews will make you fully aware of market trends! Being an InstaForex client, you are provided with a large number of free services for efficient trading.


