 Zostať
Podmienky obchodovania
Nástroje


The GBP/USD currency pair traded in a narrow range and showed low volatility on Wednesday. Thus, we maintain the view that the pair is simply undergoing a technical correction. Why specifically technical? We discussed this over the weekend. All the most resonant geopolitical developments have already been factored in, and geopolitics has begun to take a back seat, as the market cannot trade on a single factor indefinitely. At the same time, traders are in no hurry to return to macroeconomics and fundamentals. As a result, we find ourselves in a stalemate situation, where geopolitics lacks the power to stimulate movement either South or North, and the market is ignoring all other factors. Therefore, it is a technical correction.
On Tuesday and Wednesday, at least two important reports were published in the UK. However, there was no market reaction to either. It is important to note the absence of any reaction rather than the typical occurrence. Let's start with the unemployment rate. This figure decreased from 5.2% to 4.9% in March. You would agree that it is not common for unemployment to drop by 0.3% in a single month. Therefore, even on Tuesday, the British currency had a strong opportunity to continue its move to the North. This did not happen because the market continues to ignore macroeconomic data. Yet again, analysts are trying to explain any movement, or its absence, which constitutes a fundamental error.
Many experts forget that any fundamental or macroeconomic event is not an order to the market to trade in a specific direction that cannot be ignored. Traders may act on it or choose not to at their discretion. If, for them, geopolitics is currently more important, then no one can force them to trade. If the market pauses, no one can compel it to move. Therefore, there is no need to look for a "spoonful of tar" in British reports to explain the absence of growth in the British pound, or conversely, a "spoonful of honey" to justify the lack of its decline.
The inflation report showed consumer prices rose just 3.3%, while core inflation actually slowed. Since the actual figure matched forecasts, there should have been no market reaction. Nevertheless, we note that many traders expected a much stronger rise in inflation. For example, in Europe, the consumer price index accelerated by 0.7% in March, while in the USA it rose by 0.9%. Thus, the UK's +0.3% was unimpressive. Such weak acceleration gives reason to sell the British pound, as hopes arise in Great Britain that the conflict in the Middle East will have a limited impact on the economy. The UK is well-supplied with its own energy resources and can therefore cope better with inflationary pressures. Thus, at the current moment, the Bank of England can afford to continue monitoring the situation without tightening monetary policy. However, even this factor holds little significance for traders. It is still a technical correction.
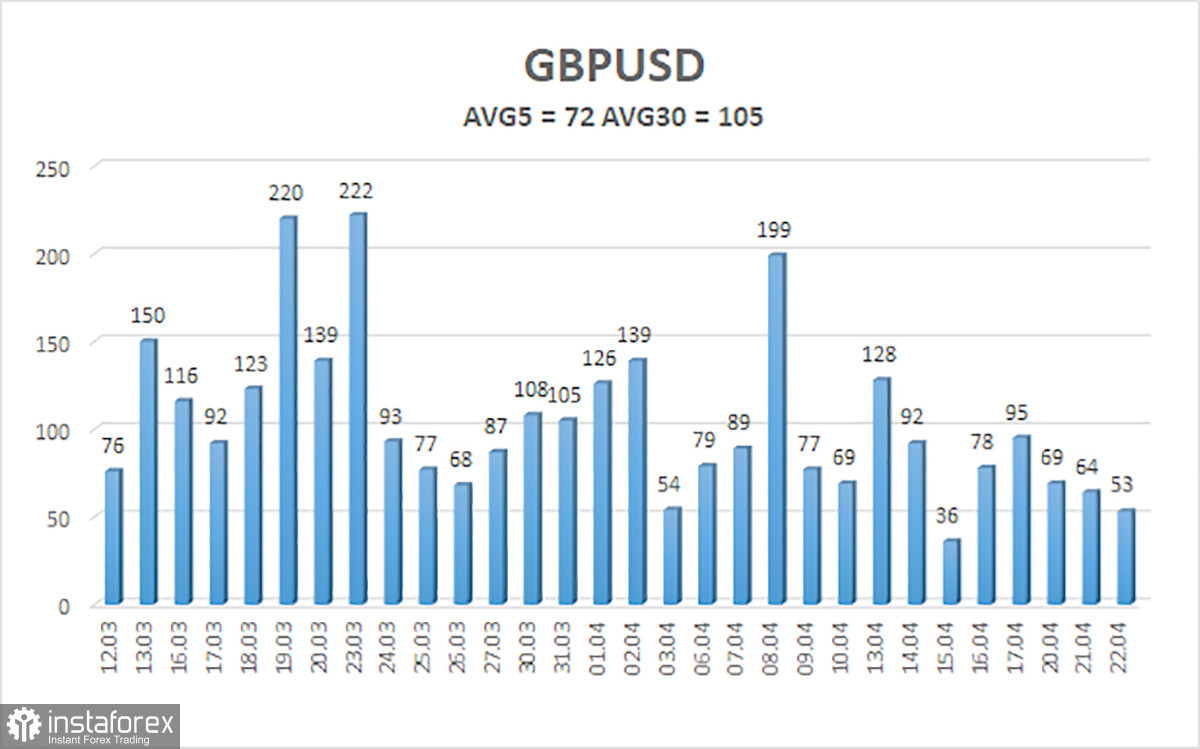
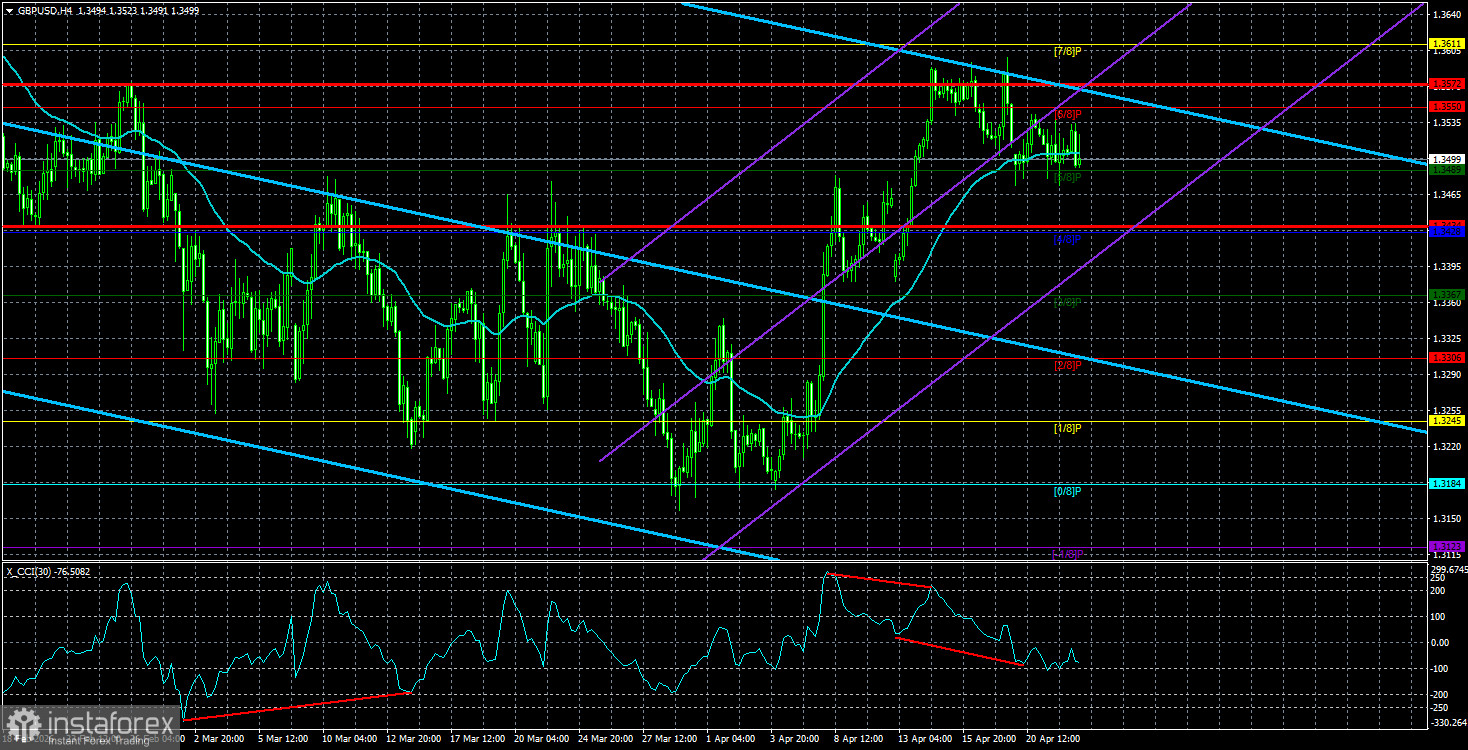
The average volatility of the GBP/USD pair over the last five trading days is 72 pips. For the pound/dollar pair, this value is considered "average." On Thursday, April 23, we expect movement within a range limited by levels of 1.3434 and 1.3572. The upper channel of the linear regression is directed downward, indicating a downward trend. The CCI indicator entered the overbought territory and formed a "bearish" divergence, warning of a downward pullback.
The GBP/USD currency pair continues to recover after two "months of geopolitics." Trump's policies will continue to exert pressure on the U.S. economy, so we do not expect the U.S. currency to grow in 2026. Thus, long positions with a target of 1.3916 and above remain relevant as long as the price is above the moving average. If the price is below the moving average line, short positions can be considered with targets of 1.3428 and 1.3367 on technical grounds. In recent weeks, the British currency has recovered, and the influence of geopolitics on the market is diminishing.
Linear regression channels help to define the current trend. If both are directed in the same way, it means the trend is currently strong;
The moving average line (settings 20,0, smoothed) determines the short-term trend and the direction in which trading should currently be conducted;
Murray levels are target levels for movements and corrections;
Volatility levels (red lines) indicate the probable price channel in which the pair will operate over the next day, based on current volatility readings;
The CCI indicator – its entrance into the oversold area (below -250) or the overbought area (above +250) indicates that a trend reversal in the opposite direction may be approaching.
InstaForex analytical reviews will make you fully aware of market trends! Being an InstaForex client, you are provided with a large number of free services for efficient trading.


