 Zostať
Podmienky obchodovania
Nástroje


The GBP/USD pair continued its downward movement on Tuesday, which began on Monday, largely due to geopolitical pressure and the threat of a stalled mythical deal between Iran and the US. Yesterday, an important US inflation report was published, but the market ignored it, just as it had ignored the Nonfarm Payrolls and unemployment reports from Friday. Thus, we can once again say that the market is disregarding macroeconomic and fundamental backgrounds. Inflation in the US rose to 3.8%, which could pressure the Federal Reserve to raise interest rates in 2026, but in practice, this is unlikely. Kevin Warsh, who will soon head the Fed, is expected to maintain "dovish" views, and the US labor market has not fully recovered—any new policy tightening would again put pressure on jobs and businesses. Therefore, rising inflation does not yet indicate that the Fed will adopt a more "hawkish" stance. As a result, the dollar cannot rely on strong strengthening.
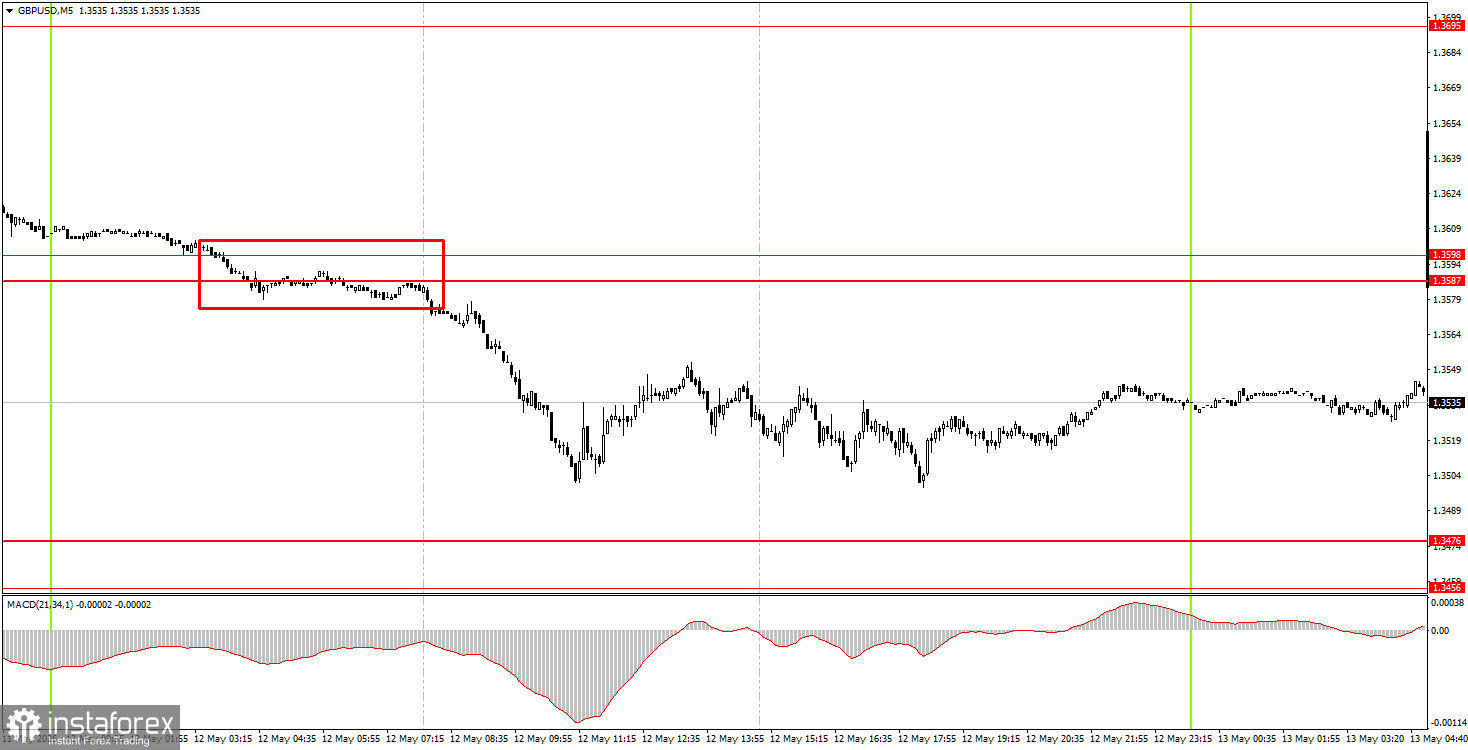
On the 5-minute timeframe, one trading signal for selling was formed on Tuesday. At the very beginning of the European trading session, the pair broke through the area of 1.3587-1.3598, prompting a decline of 50-60 pips during the day. By the end of the day, beginner traders could have closed their trades manually several times for a good profit.
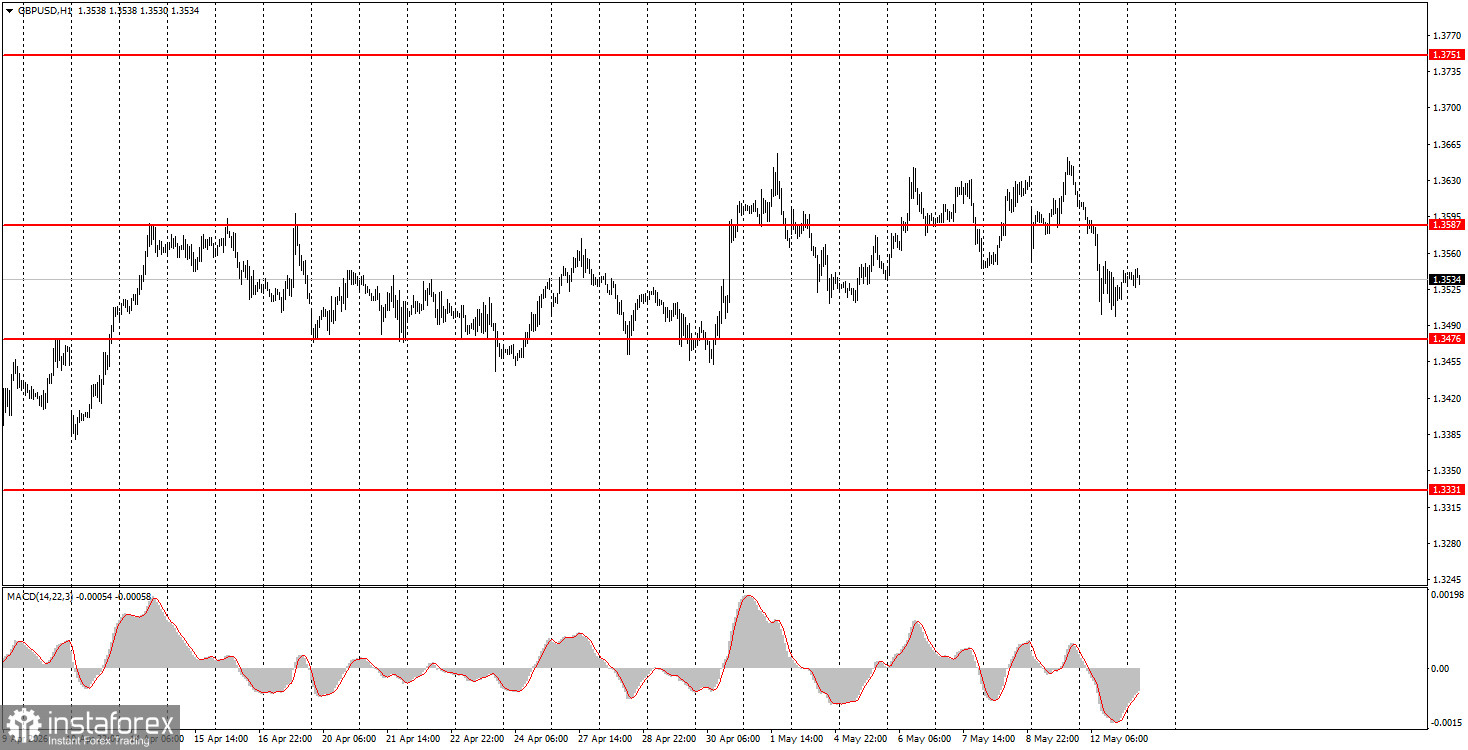
On the hourly timeframe, the GBP/USD pair maintains an upward trend, but it has been trading with a sideways bias for almost a month. Without a serious escalation in the Middle East, the dollar cannot be expected to rise as it did in February-March. Individual events may still provoke their strengthening, but overall, the geopolitical factor has weakened its influence on the market. The British currency retains excellent upward prospects according to the daily and weekly timeframes.
On Wednesday, beginner traders may open short positions targeting the 1.3456-1.3476 area if the pair bounces from the 1.3587-1.3598 area. A bounce from the 1.3456-1.3476 area will allow for opening long positions targeting 1.3587-1.3598.
On the 5-minute timeframe, the following levels can be traded: 1.3175-1.3180, 1.3259-1.3267, 1.3319-1.3331, 1.3380-1.3386, 1.3456-1.3476, 1.3587-1.3598, 1.3695, and 1.3741-1.3751. Today, the UK economic calendar is completely empty, while in the US, the Producer Price Index will be released, which, after yesterday's inflation report, essentially means nothing.
Price levels (areas) of support and resistance – levels that are targets when opening purchases or sales, or sources of signals.
Red lines – channels or trend lines that display the current trend and indicate which direction is preferable to trade now.
MACD indicator (14, 22, 3) – histogram and signal line – a supporting indicator that can also be used as a source of signals.
Important speeches and reports (contained in the news calendar) can significantly influence the movement of the currency pair. Therefore, during their release, trading should be done as cautiously as possible, or one should exit the market to avoid a sharp price reversal against the preceding movement.
Beginners trading in the Forex market should remember that not every trade can be profitable. Developing a clear strategy and sound money management are key to long-term trading success.
InstaForex analytical reviews will make you fully aware of market trends! Being an InstaForex client, you are provided with a large number of free services for efficient trading.


