 Zostať
Podmienky obchodovania
Nástroje



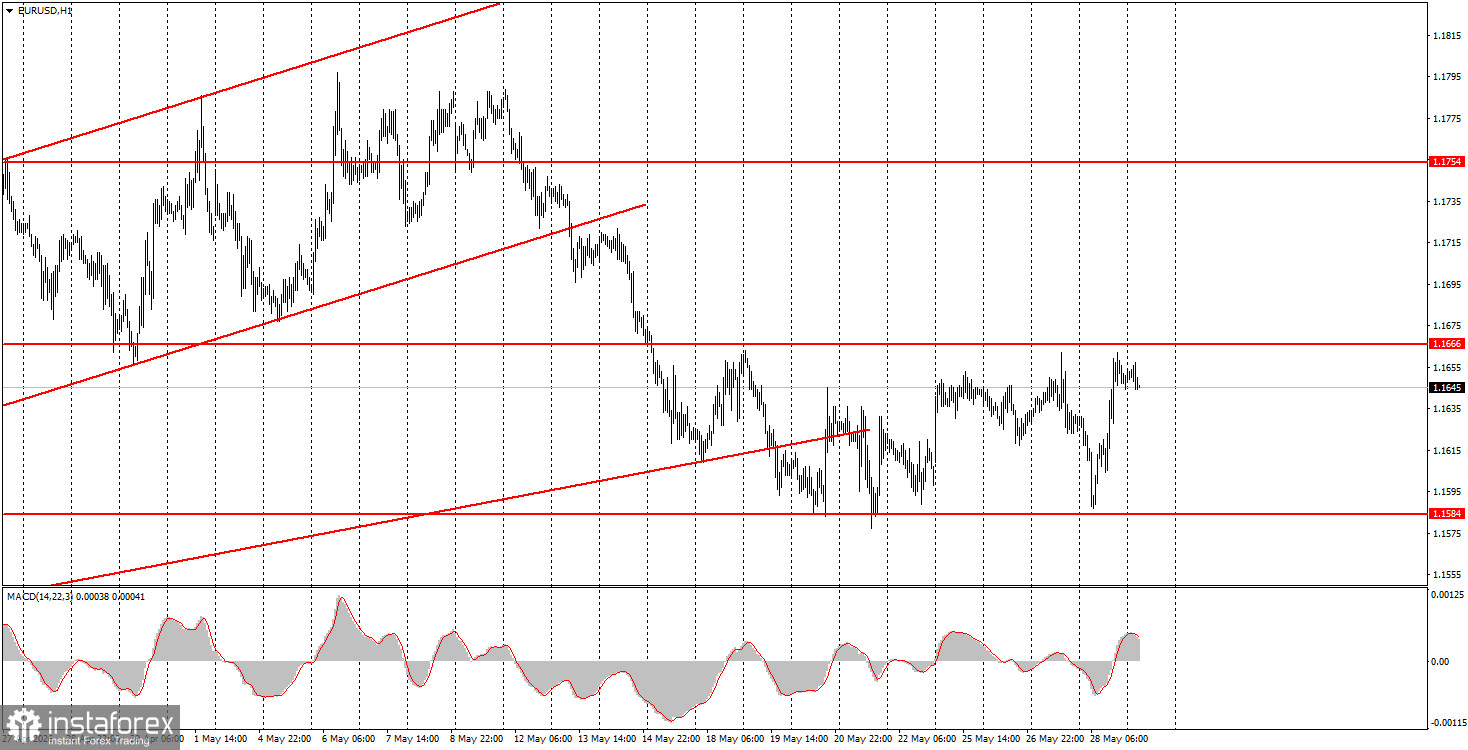
The EUR/USD currency pair moved both up and down throughout Thursday. The morning drop was due to the overnight exchanges of fire between Iran and the U.S. The world witnessed yet another violation of the ceasefire in the Middle East, and the chances of reaching a deal in the near future remain close to negative values. Therefore, the renewed strength of the dollar was not unexpected. In the second half of the day, the European currency gained ground, which can be explained by two factors. First, the pair has been trading in a sideways channel for several weeks, as shown on the hourly chart. Accordingly, upon reaching the lower boundary of the sideways channel, a movement towards the upper boundary began. Second, the macroeconomic data from the U.S. did not disappoint per se, but the key GDP report in its second estimate for the first quarter once again did not please traders with its figure – growth of only 1.6% against forecasts of +2.0%. Thus, we observed entirely logical movements, which has become a rarity lately.
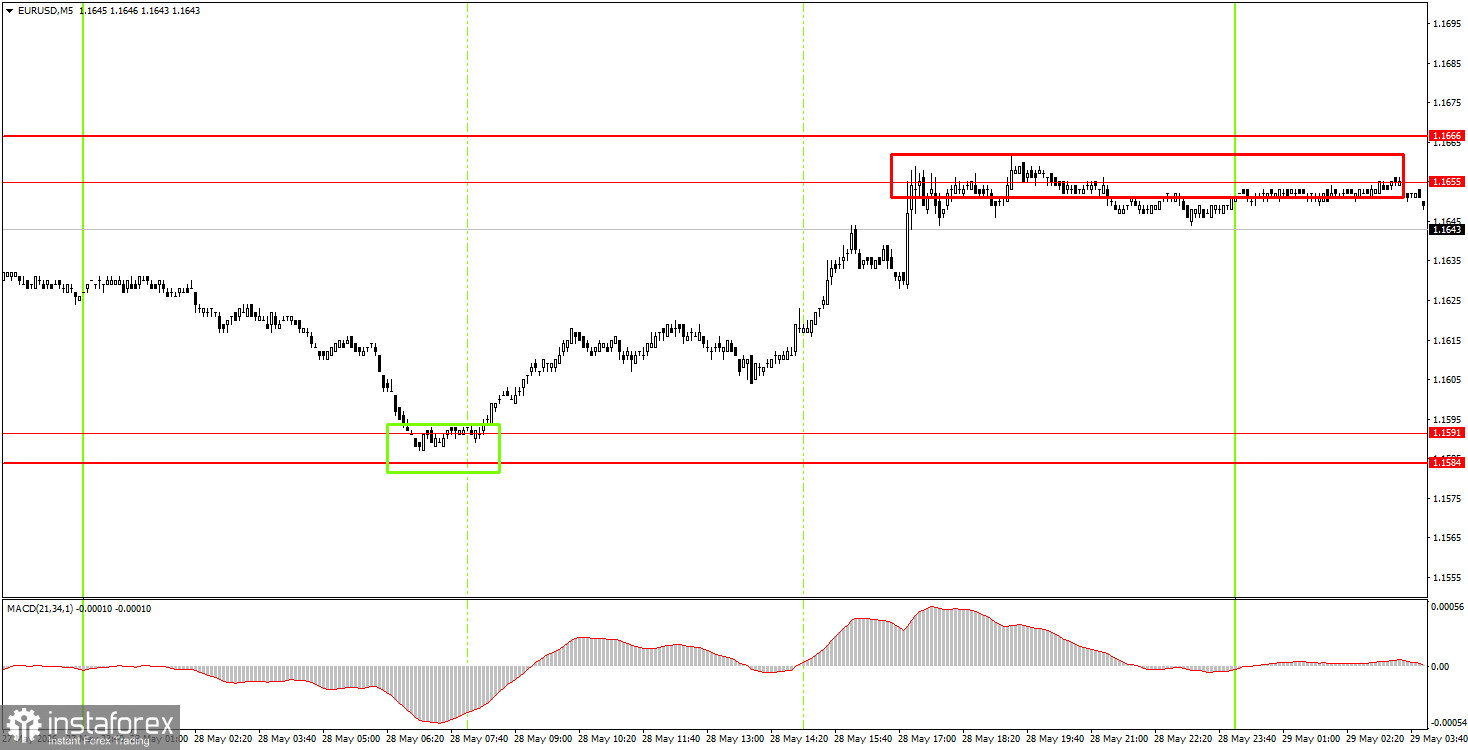
On the 5-minute timeframe, the pair formed two excellent trading signals on Thursday. In the morning, the price bounced from the 1.1584-1.1591 area, and during the American session, it reached the nearest target area at 1.1655-1.1666. As a result, novice traders could earn about 45 pips on long positions. The second sell signal was triggered late last night — the price bounced from the 1.1655-1.1666 area, allowing traders to open short positions.
On the hourly timeframe, the euro has been correcting for a month and a half. The U.S. currency has resumed growth as the conflict in the Middle East is on the verge of full escalation, but we still do not expect prolonged growth for the American currency. The market continues to largely ignore fundamentals and macroeconomics, while geopolitics swings the EUR/USD pair up and down.
On Friday, novice traders may open short positions targeting 1.1584-1.1591, as the price has bounced from the 1.1655-1.1666 area. New long positions can be considered if the price consolidates above the 1.1655-1.1666 area, with a target of 1.1745-1.1754.
On the 5-minute timeframe, the levels to consider are 1.1354-1.1363, 1.1413, 1.1455-1.1474, 1.1527-1.1531, 1.1584-1.1591, 1.1655-1.1666, 1.1745-1.1754, 1.1830-1.1837, and 1.1899-1.1908. On Friday, Germany will publish unemployment and inflation reports, but they are unlikely to affect market sentiment or move the pair out of the sideways channel.
Price levels (areas) of support and resistance – levels that are targets when opening purchases or sales, or sources of signals.
Red lines – channels or trend lines that show the current trend and indicate the preferred direction to trade now.
MACD indicator (14, 22, 3) – histogram and signal line – a supporting indicator that can also be used as a source of signals.
Important speeches and reports (contained in the news calendar) can significantly influence the movement of the currency pair. Therefore, during their release, trading should be done as cautiously as possible, or one should exit the market to avoid a sharp price reversal against the preceding movement.
Beginners trading in the Forex market should remember that not every trade can be profitable. Developing a clear strategy and effective money management are key to long-term trading success.
InstaForex analytical reviews will make you fully aware of market trends! Being an InstaForex client, you are provided with a large number of free services for efficient trading.


