 Zostať

Podmienky obchodovania
Nástroje


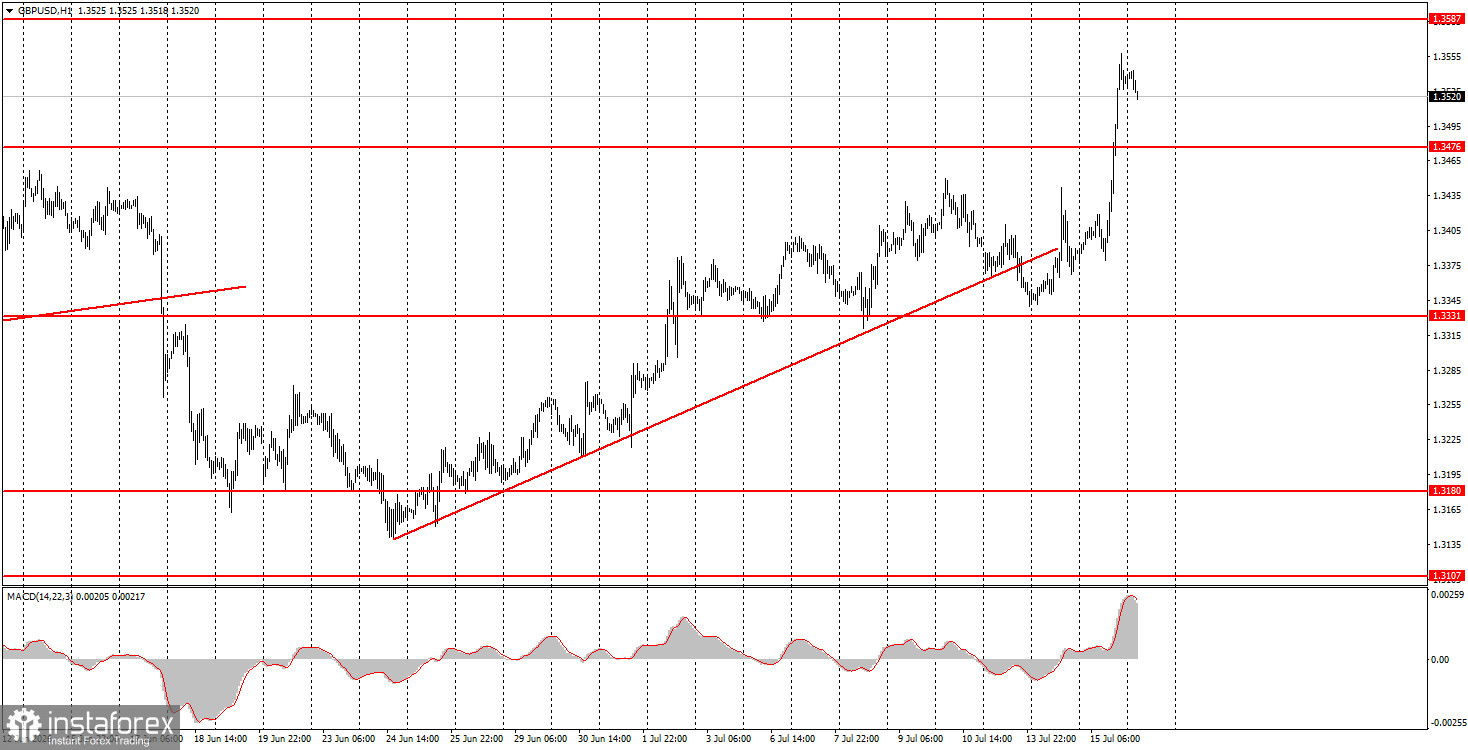
The GBP/USD pair continued its upward movement on Wednesday, although there were significantly fewer local grounds for it than on Tuesday. Recall that on Tuesday, the most important report of the week—on inflation—was released in the U.S. The report was resonant and unexpected, with the inflation rate dropping to 3.5%, prompting the Federal Reserve to potentially soften its "hawkish" stance on monetary policy. Thus, the dollar's decline on Tuesday is understandable. However, the only interesting event on Wednesday was the U.S. producer price index, which also did not favor the dollar as it slowed more than expected. Yet the American currency's 150-pip decline seemed excessive. There was, however, one caveat. In the long term, and given global factors, the British pound should have continued its rise regardless. We believe that the U.S. dollar has exhausted all its growth factors in 2026, so the British pound does not require local grounds for its increase.
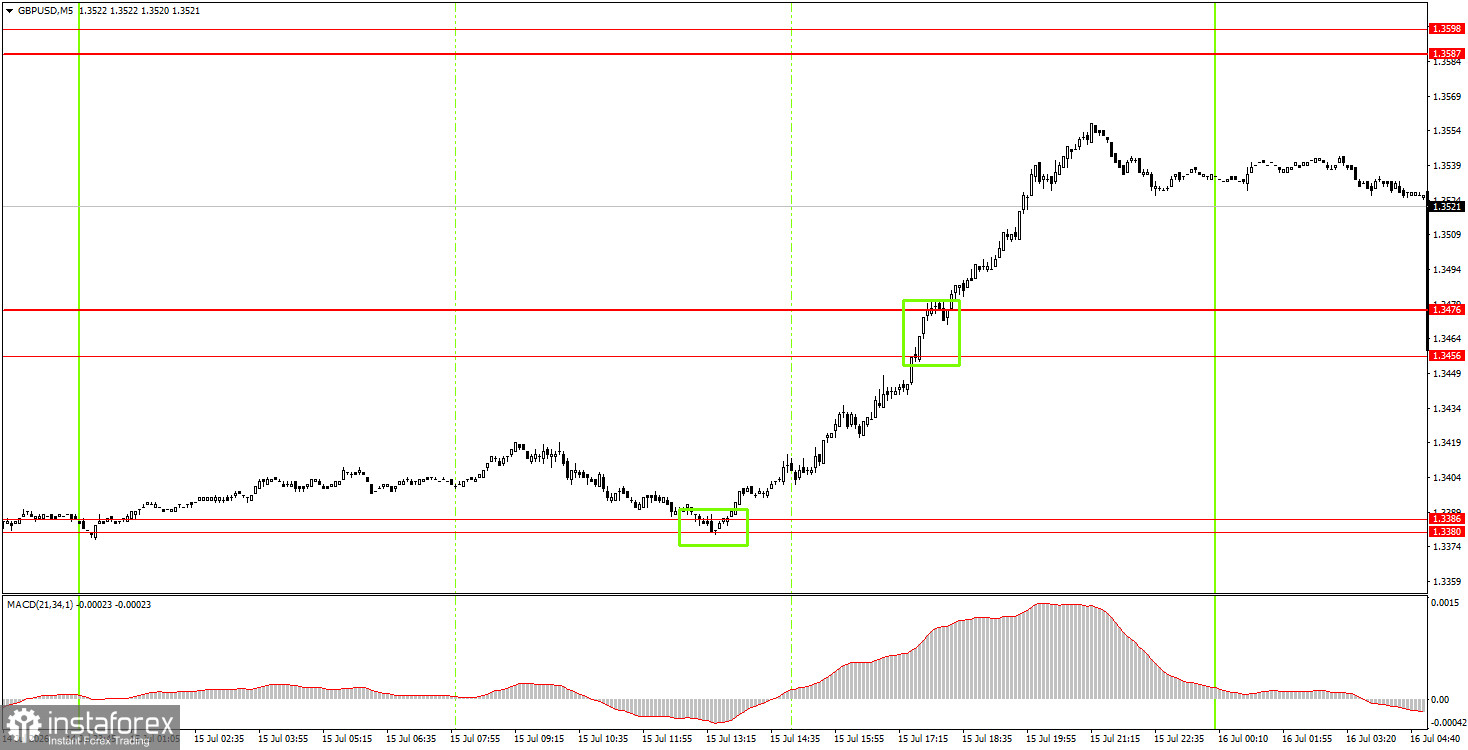
On the 5-minute timeframe, two trading signals were formed on Wednesday. During the European trading session, the pair bounced from the area of 1.3380-1.3386, and during the American session, it surpassed the range of 1.3456-1.3476. Therefore, novice traders could open long positions in the first half of the day and close them for a profit of about 135 pips by the end of the day.
On the hourly timeframe, the GBP/USD pair has resumed its upward trend. The conflict in the Middle East is currently on pause, but Iran and the U.S. are racing toward a long-term confrontation; however, a full-scale war has not yet resumed. We believe that the last three weeks of the pound's growth represent a restoration of fair value and a technical movement justified by the sideways channel on higher timeframes.
On Thursday, novice traders may open short positions when the price bounces from the range of 1.3587-1.3598, targeting 1.3456-1.3476. A bounce from the area of 1.3456-1.3476 will allow for the opening of new long positions with a target of 1.3587-1.3598.
On the 5-minute timeframe, trading levels include 1.3096-1.3107, 1.3175-1.3180, 1.3259-1.3267, 1.3319-1.3331, 1.3380-1.3386, 1.3456-1.3476, 1.3587-1.3598, 1.3631-1.3641, and 1.3695. On Thursday, reports on GDP and industrial production for May are scheduled for release in the U.K., while the U.S. will publish retail sales and unemployment claims data. We do not expect the market reaction to these data to be significant.
Price levels (areas) of support and resistance are targets when opening long or short positions or sources of signals.
Red lines indicate channels or trend lines that display the current trend and indicate the preferred direction for trading.
The MACD indicator (14,22,3) – histogram and signal line – is a supplementary indicator that can also be used as a source of signals.
Important speeches and reports (contained in the news calendar) can significantly impact the movement of the currency pair. Therefore, during their release, trading should be conducted with maximum caution, or one should exit the market to avoid sharp reversals against preceding movements.
Beginners trading in the forex market should remember that not every trade can be profitable. Developing a clear strategy and practicing money management are key to long-term success in trading.
InstaForex analytical reviews will make you fully aware of market trends! Being an InstaForex client, you are provided with a large number of free services for efficient trading.


