 Zostať

Podmienky obchodovania
Nástroje


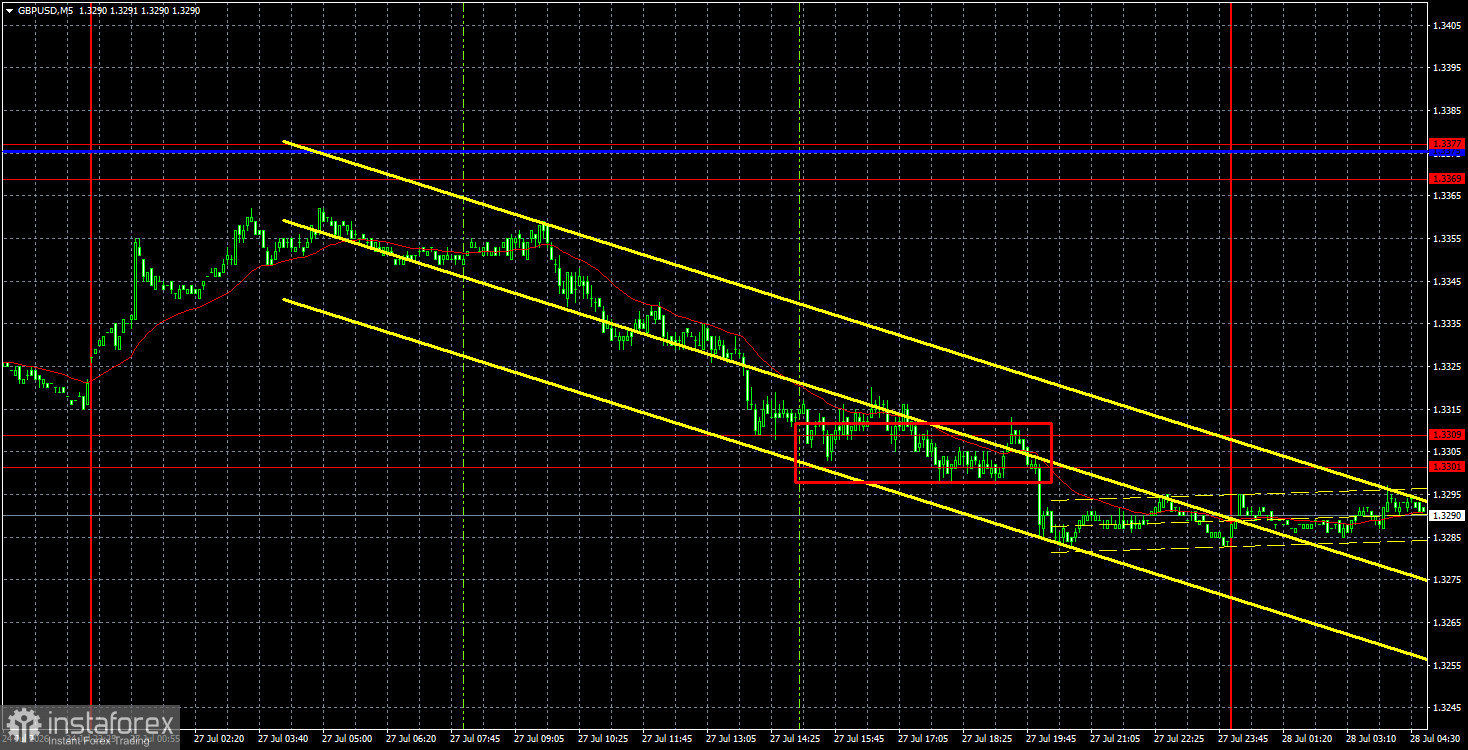
On Monday, the GBP/USD currency pair exhibited movements that can hardly be described as logical. It's chaotic. It seems traders are simply unsure of what to expect from Iran and the US moving forward, leading each trader to open positions according to their personal interpretations of the situation. However, what this "understanding" entails is unknown to other market participants.
Yesterday, the British pound began the day with a logical rise as Iran and the US once again halted their fire. However, within a few hours, it became clear that while the bombings had ceased, negotiations had not resumed and were unlikely to do so anytime soon. Reports emerged that Iran would attempt to open the Strait of Hormuz alongside Oman, but what to do about the US, which is blocking Iranian ports, remains unclear. Additionally, news surfaced that Donald Trump ordered the cessation of bombings not because he considers it a step towards diplomacy, but because interceptor missile stocks have drastically diminished. Overall, what is happening in the Middle East and where it will lead is completely unclear.
From the macroeconomic data, the orders for durable goods report in the US was noted, which showed a value of +0.3% against forecasts of +2.5%. However, the market paid no attention to this report, with the dollar steadily strengthening throughout the day.
From a technical perspective, the British pound broke the descending trendline and resumed its decline calmly. Thus, the current downward trend is disrupted but remains in play. Today, trading can take place from the area of 1.3301-1.3309.
On the 5-minute timeframe, one trading signal was formed on Monday. During the American trading session, the pair surpassed the area of 1.3301-1.3309, which allowed traders to open short positions, albeit not at the most advantageous point. Today, the decline in quotes may continue.
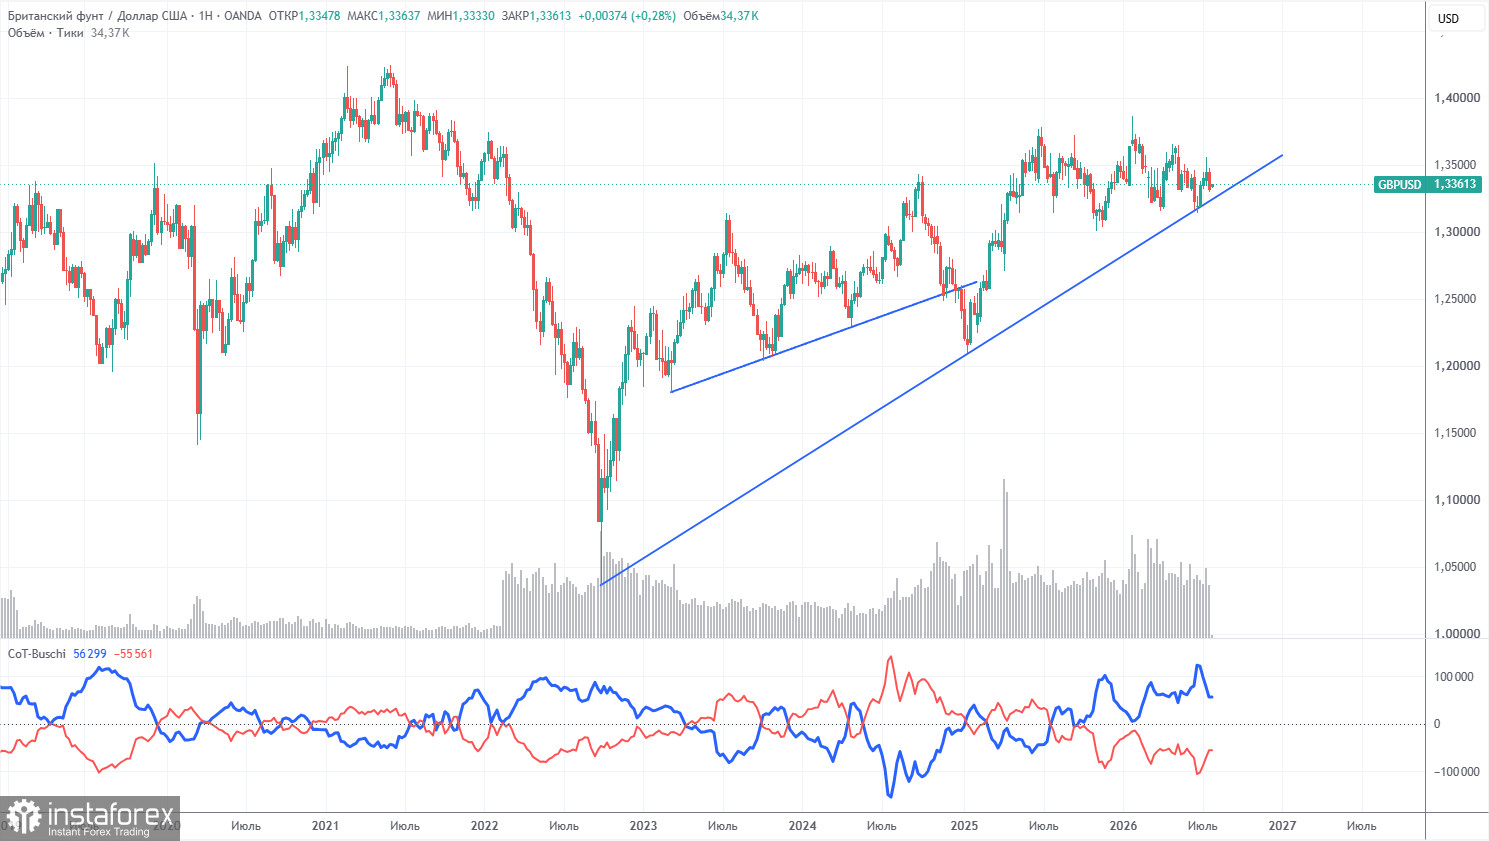
COT reports for the British pound show that non-commercial traders have dominated the market with sales for several months now. The net position is negative despite the long-term upward trend being intact. Given the events in the Middle East, it is no surprise that demand for risk currencies remains weak. The war is formally over, but the conflict continues. This geopolitics may support demand for the US dollar in the near term. However, until the price settles below the trendline, we would not expect a strong decline in the pair.
In the long term, the dollar will continue to weaken due to Donald Trump's policies, as seen on the weekly timeframe. The trade war will continue in one form or another for a long time, and Trump's policies are directly and indirectly aimed at weakening the US currency. The long-term upward trend remains, as evidenced by the trendline. The price recently interacted with this line and bounced off. According to the latest COT report (dated July 21), the "Non-commercial" group opened 13,200 BUY contracts and closed 2,500 SELL contracts. Thus, the net position of non-commercial traders increased by 15,500 contracts over the week.
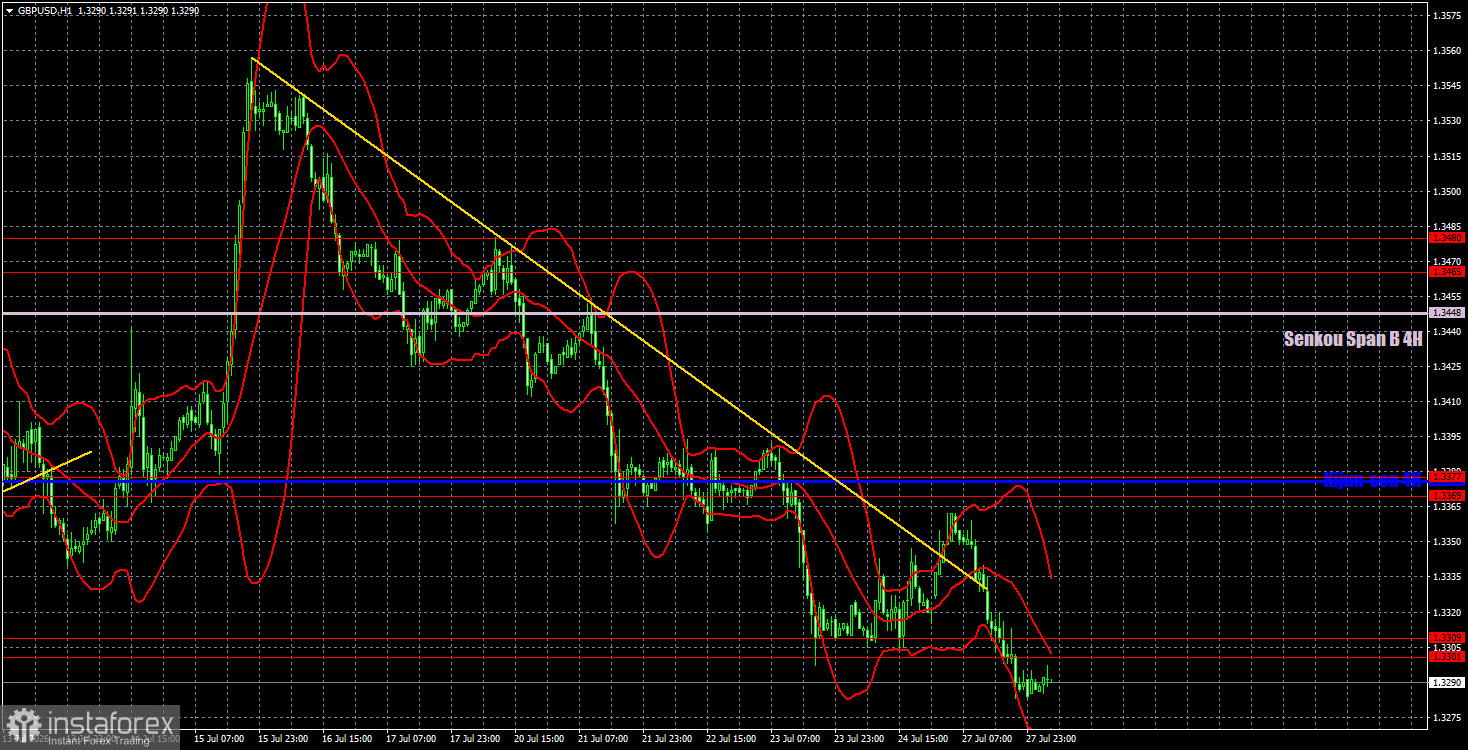
On the hourly timeframe, the GBP/USD pair has returned to the downward trend, for which there are currently no solid reasons to continue. If Tehran and Washington resume negotiations, it would help risk currencies like the euro and pound. In the long term, both currencies still have a bullish outlook, as they have been in sideways channels for the past year. This does not negate the upward trend that began back in 2022.
For July 28, we highlight the following important levels: 1.3042-1.3050, 1.3096-1.3115, 1.3179-1.3187, 1.3301-1.3309, 1.3369-1.3377, 1.3465-1.3480, 1.3588, 1.3671-1.3681. The Senkou Span B (1.3448) and Kijun-sen (1.3374) lines may also serve as sources of signals. It is recommended to set a Stop Loss at breakeven when the price moves 20 pips in the correct direction. The lines of the Ichimoku indicator may shift throughout the day, which should be taken into account when determining trading signals.
On Tuesday, the event calendar is empty in the UK, while in the US, only a few minor reports are expected that are unlikely to gain anyone's attention. Thus, technical factors will dominate trading today.
Today, traders may stay in short positions targeting the area of 1.3179-1.3187, as the price settled below the area of 1.3301-1.3309 yesterday. Long positions can be opened if the price settles above the area of 1.3301-1.3309 with a target in the area of 1.3369-1.3377, as the descending trendline has been broken.
Support and resistance levels are indicated by thick red lines, near which the movement may come to an end. They are not sources of trading signals.
The Kijun-sen and Senkou Span B lines are Ichimoku indicator lines transferred to the hourly timeframe from the 4-hour one. They are strong lines.
Extreme levels are indicated by thin red lines, from which the price previously bounced. They are sources of trading signals.
Yellow lines represent trend lines, trend channels, and any other technical patterns.
Indicator 1 on the COT charts represents the size of the net position for each category of traders.
InstaForex analytical reviews will make you fully aware of market trends! Being an InstaForex client, you are provided with a large number of free services for efficient trading.


