 Zostať

Podmienky obchodovania
Nástroje


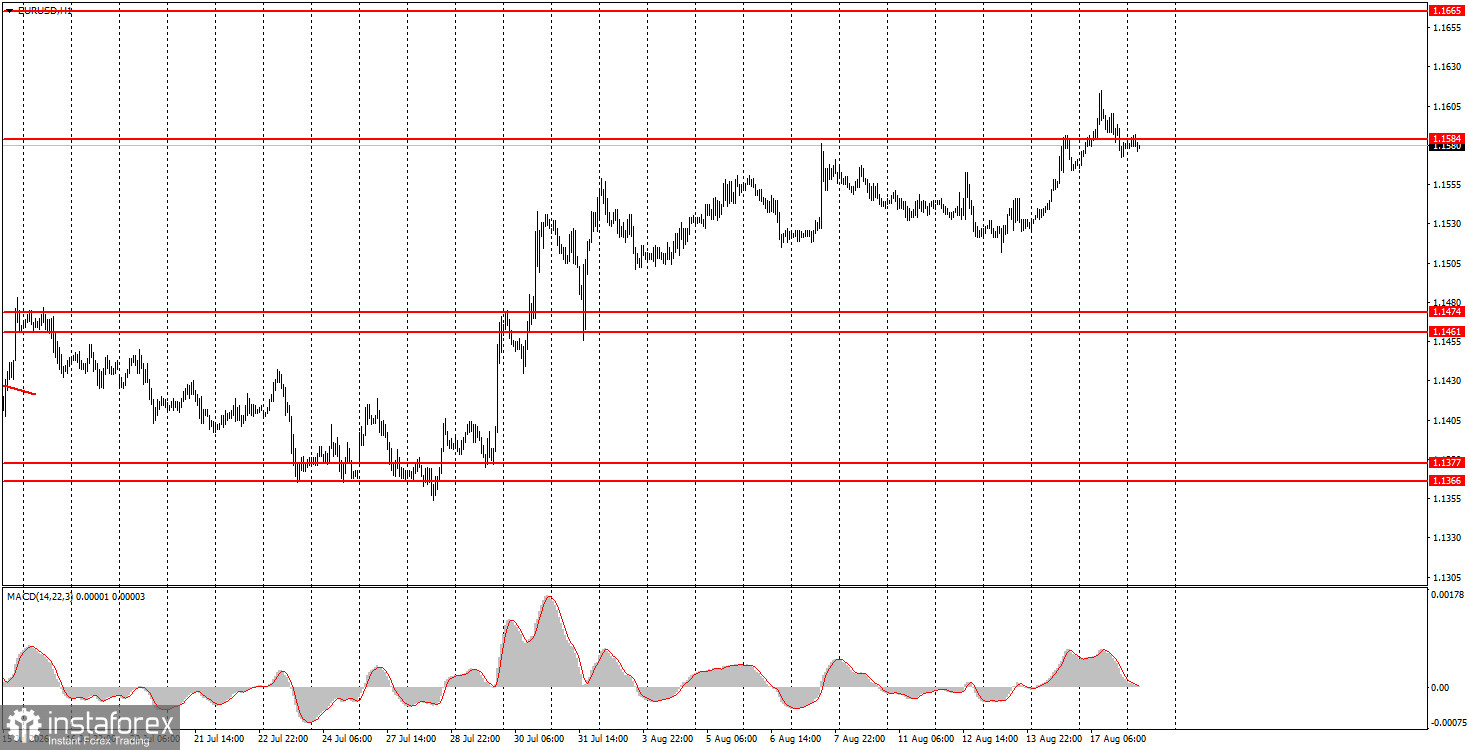
The EUR/USD currency pair was unable to continue its upward movement during Monday's trading after some less-than-positive geopolitical news came in during the afternoon. There is currently no reason for panic, but Iran warned the U.S. that if the naval blockade of the Strait of Hormuz is not lifted soon, Tehran will remove it by its own means. In simple terms, Tehran intends to reclaim the Strait of Hormuz and is prepared to take new military action if necessary. In our view, such a move by Iran will inevitably lead to escalation of the conflict, but Iran effectively has no other path if it does not want to be in a besieged position for another 5 to 10 years. It is difficult to say what the new escalation will lead to, but it clearly will not result in lower oil prices. Thus, the more escalation-related news that comes to market in the near term, the fewer chances there will be for continued growth of the euro and pound. Geopolitics will, at the very least, impede the upward momentum.
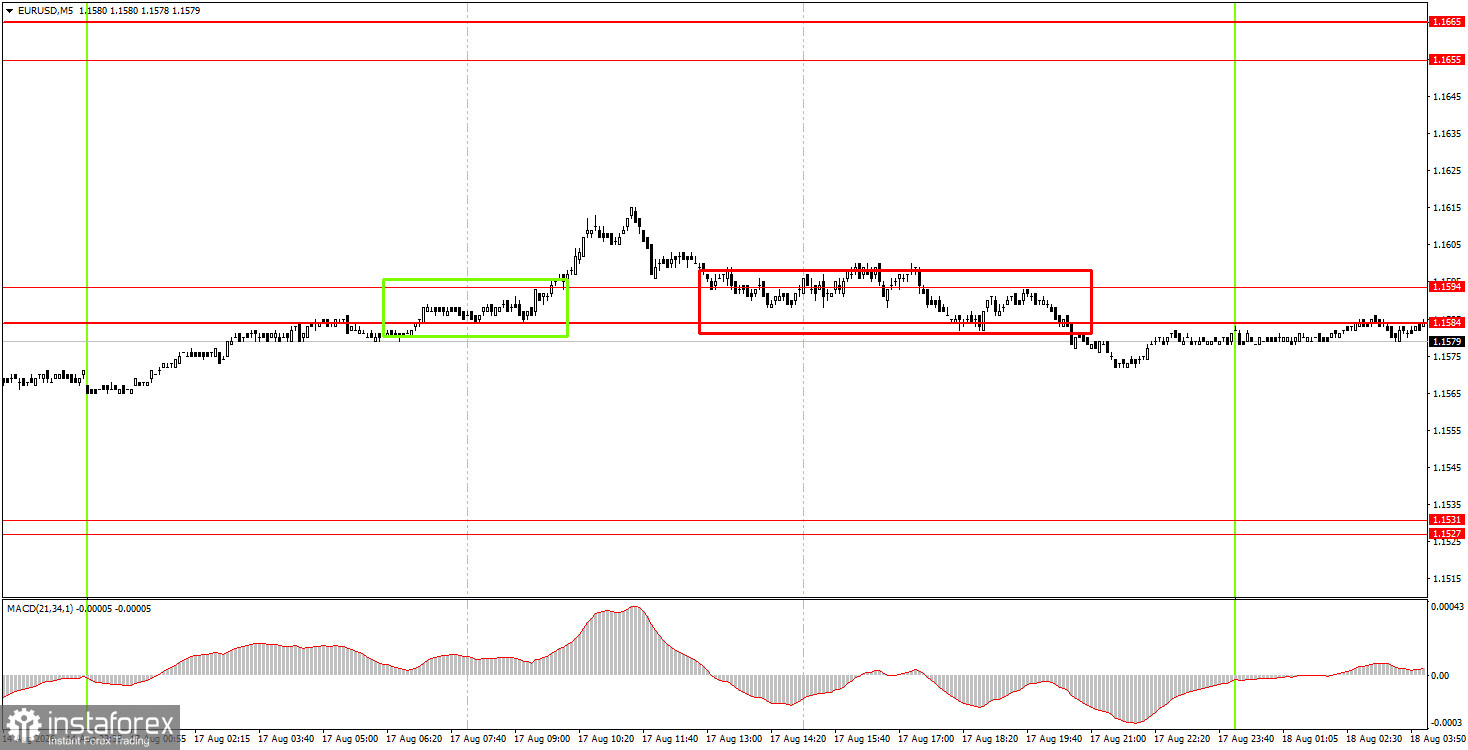
In the 5-minute timeframe, two trading signals were formed on Monday, neither of which generated significant profit for traders. It should be emphasized again that the pair's volatility throughout the day was quite low, so high profits were not to be expected. Both signals marked on the illustration could have been utilized by novice traders. The first trade closed at stop-loss at breakeven, while the second trade may still be open.
On the hourly timeframe, the EUR/USD pair continues to form an upward trend. Considering recent events, we believe the European currency should continue to grow with confidence. In recent months, the market has stubbornly ignored many factors in favor of the euro, which is why we still expect it to move higher unless geopolitical issues intervene.
On Tuesday, novice traders may stay in short positions with targets at 1.1527-1.1531, as price has settled below the 1.1584-1.1594 range. Buy trades can be opened if the 1.1584-1.1594 area is breached, targeting 1.1655-1.1665.
On the 5-minute timeframe, the following levels should be considered: 1.1267-1.1275, 1.1366-1.1377, 1.1461-1.1474, 1.1527-1.1531, 1.1584-1.1594, 1.1655-1.1665, 1.1745-1.1754. On Tuesday, the Eurozone will publish the ZEW economic sentiment indices, while the U.S. will release secondary reports on the construction sector. We believe all these reports will likely provoke only a very minor reaction from the market.
Support and resistance price levels (areas) are the targets when opening buy or sell orders or sources of signals.
Red lines denote channels or trend lines that reflect the current trend and indicate in which direction trading is currently favored.
The MACD indicator (14,22,3) – histogram and signal line – is a supporting indicator that can also be used as a source of signals.
Important speeches and reports (as listed in the news calendar) can significantly influence the movement of the currency pair. Therefore, during their release, trading should be approached with utmost caution, or one should exit the market to avoid sharp price reversals against the preceding movement.
Beginners in Forex trading should remember that not every trade can be profitable. Developing a clear strategy and proper money management are essential for long-term trading success.
InstaForex analytical reviews will make you fully aware of market trends! Being an InstaForex client, you are provided with a large number of free services for efficient trading.


