 Zostať

Podmienky obchodovania
Nástroje


The GBP/USD currency pair also showed decent growth on Wednesday, which fully aligns with the current technical, fundamental, and macroeconomic picture. It's worth noting that all the most important reports from overseas have failed in recent weeks. The Federal Reserve is only in the dreams of some traders and analysts preparing for a tightening of monetary policy. Geopolitics is no longer supporting the dollar, as nothing extraordinary is happening in the Middle East. The technical picture across all timeframes indicates an upward trend. Yesterday, inflation data for July was also released in the UK. The report was rather dull, and we cannot say it specifically triggered a strong rise in the pound and euro. Nevertheless, inflation in the UK rose, bringing the Bank of England closer to a potential rate hike. Thus, partly, the Consumer Price Index (CPI) may be blamed for the growth of the British currency. Unlike the Fed, the BoE is likely to raise the key rate without hesitation, while the dollar currently has no basis for growth. The weekly timeframe continues to show movement from the lower boundary of the sideways channel to the upper.
From a technical perspective, the British pound continues to form an upward trend on the hourly timeframe, as indicated by the trend line. In the long term, the pair is in a sideways channel and may resume the global upward trend of 2022. Thus, the pound could easily move up another 100-150 pips. The dollar may experience corrections from time to time, but it is unlikely to see significant strengthening.
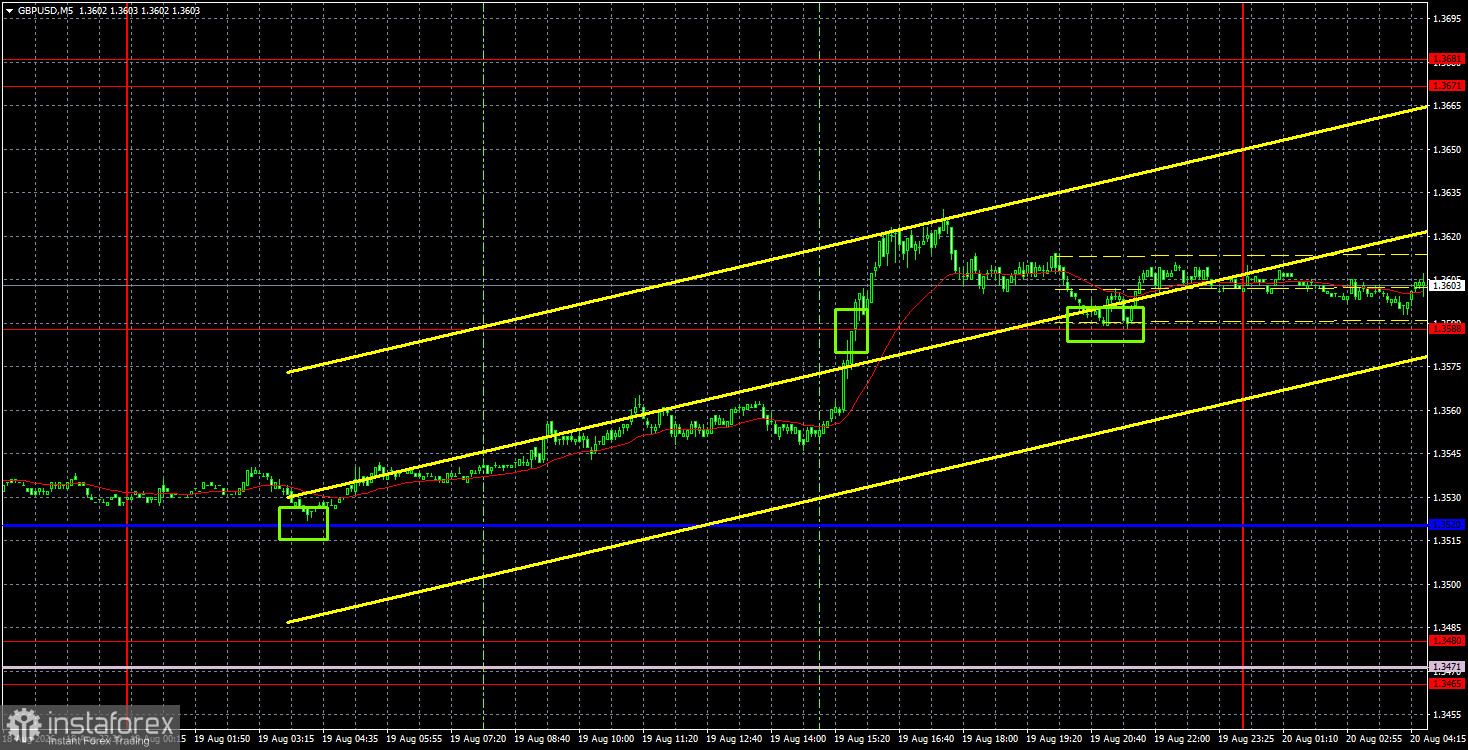
On the 5-minute timeframe on Wednesday, three buy signals were formed. Early in the Asian trading session, the price bounced off a critical line, allowing traders to open long positions based on this signal at the start of the European session. During the American session, the price first surpassed 1.3588 and then bounced off it from above. Therefore, long positions can be maintained into Thursday.
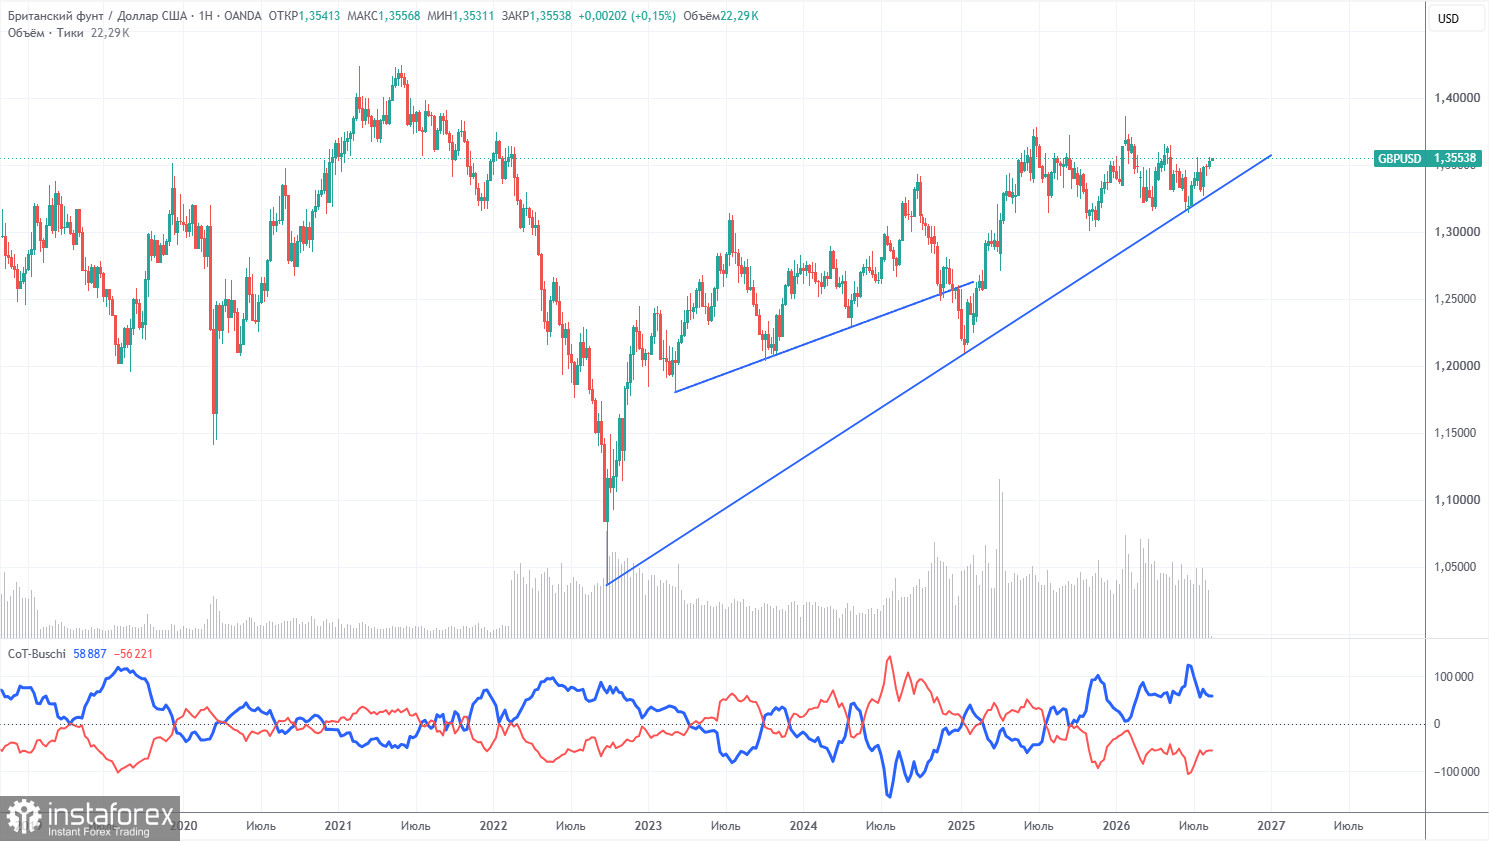
COT reports for the British pound show that non-commercial traders have dominated the market, holding selling positions for several months. The net position remains negative, despite the long-term upward trend. Given the events in the Middle East, it is not surprising that demand for riskier currencies remains weak. The war is formally over, but the conflict persists. Geopolitics could support demand for the U.S. dollar in the near term. However, we would not expect a significant decline in the pair until it consolidates below the trend line.
In the long term, the dollar will continue to decline due to Trump's policies, as seen clearly on the weekly timeframe. The trade war will continue in one form or another for a long time, and Trump's policies are aimed both directly and indirectly at weakening the American currency. The long-term upward trend remains, as indicated by the trend line. The price has recently interacted with this line and has rebounded from it. According to the latest COT report (dated August 11), the "Non-commercial" group opened 10,300 BUY contracts and 8,600 SELL contracts. Thus, the net position of non-commercial traders increased by 1,700 contracts over the week.
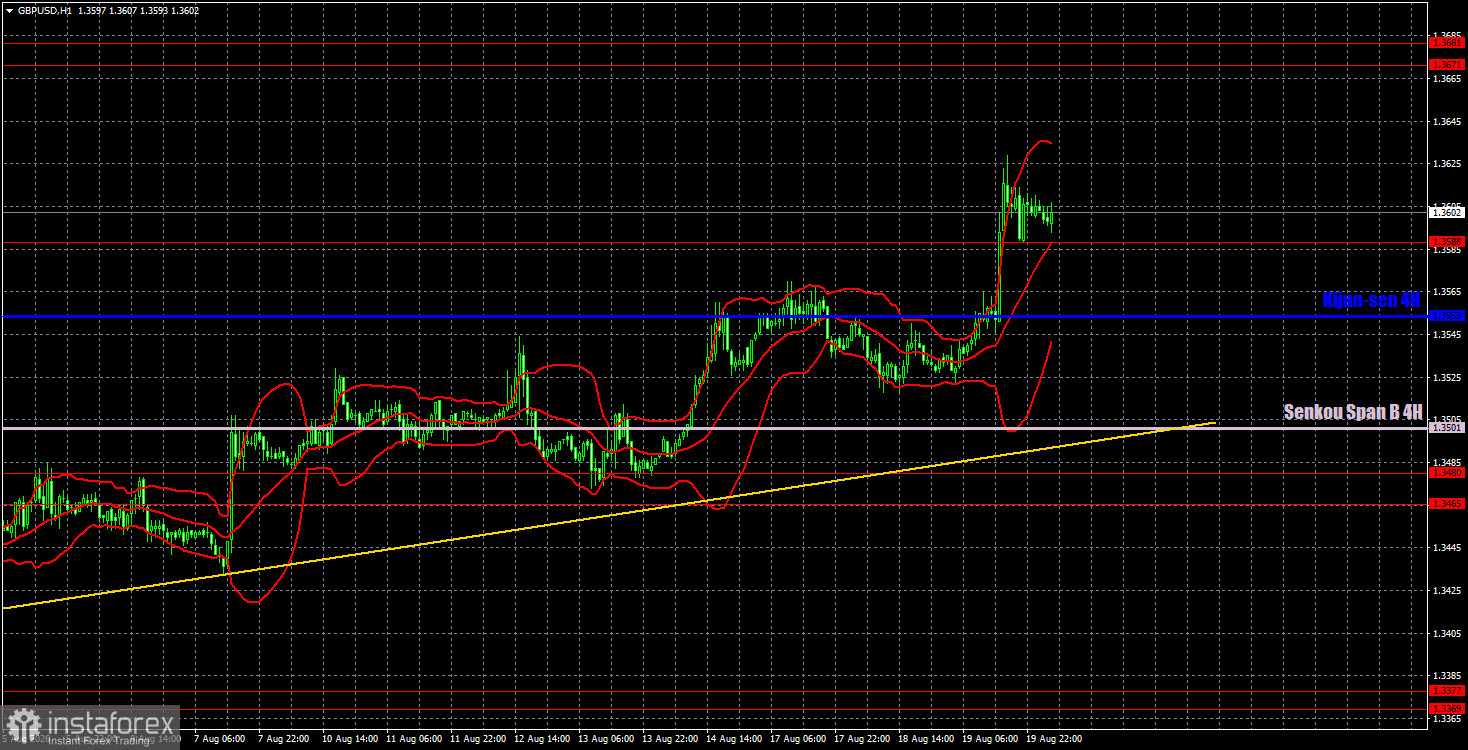
On the hourly timeframe, the GBP/USD pair continues to form an upward trend, as indicated by the trend line and Ichimoku indicator lines. In the long term, both European currencies still "look" higher and have been trading within sideways channels for an entire year. This does not negate the upward trend that began back in 2022. We expect the British pound to continue its growth in the coming weeks. The upward trend will be interrupted if the price settles below the trend line.
For August 20, we highlight the following important levels: 1.3042-1.3050, 1.3096-1.3115, 1.3179-1.3187, 1.3301-1.3309, 1.3369-1.3377, 1.3465-1.3480, 1.3588, 1.3671-1.3681. The Senkou Span B line (1.3501) and the Kijun-sen line (1.3553) may also serve as sources of signals. It is recommended to set the stop-loss to break even when the price moves in the correct direction by 20 pips. The Ichimoku indicator lines may shift throughout the day, which should be taken into account when determining trading signals.
On Thursday, no important events or reports are scheduled in either the UK or the U.S., so traders will have little to react to throughout the day. However, the pair's upward movement may very well continue.
Today, traders may open short positions targeting 1.3553 and 1.3501 if the price settles below 1.3588. Long positions can be maintained after a break above 1.3588, provided the price bounces off that level.
InstaForex analytical reviews will make you fully aware of market trends! Being an InstaForex client, you are provided with a large number of free services for efficient trading.


