 Zostať
Podmienky obchodovania
Nástroje



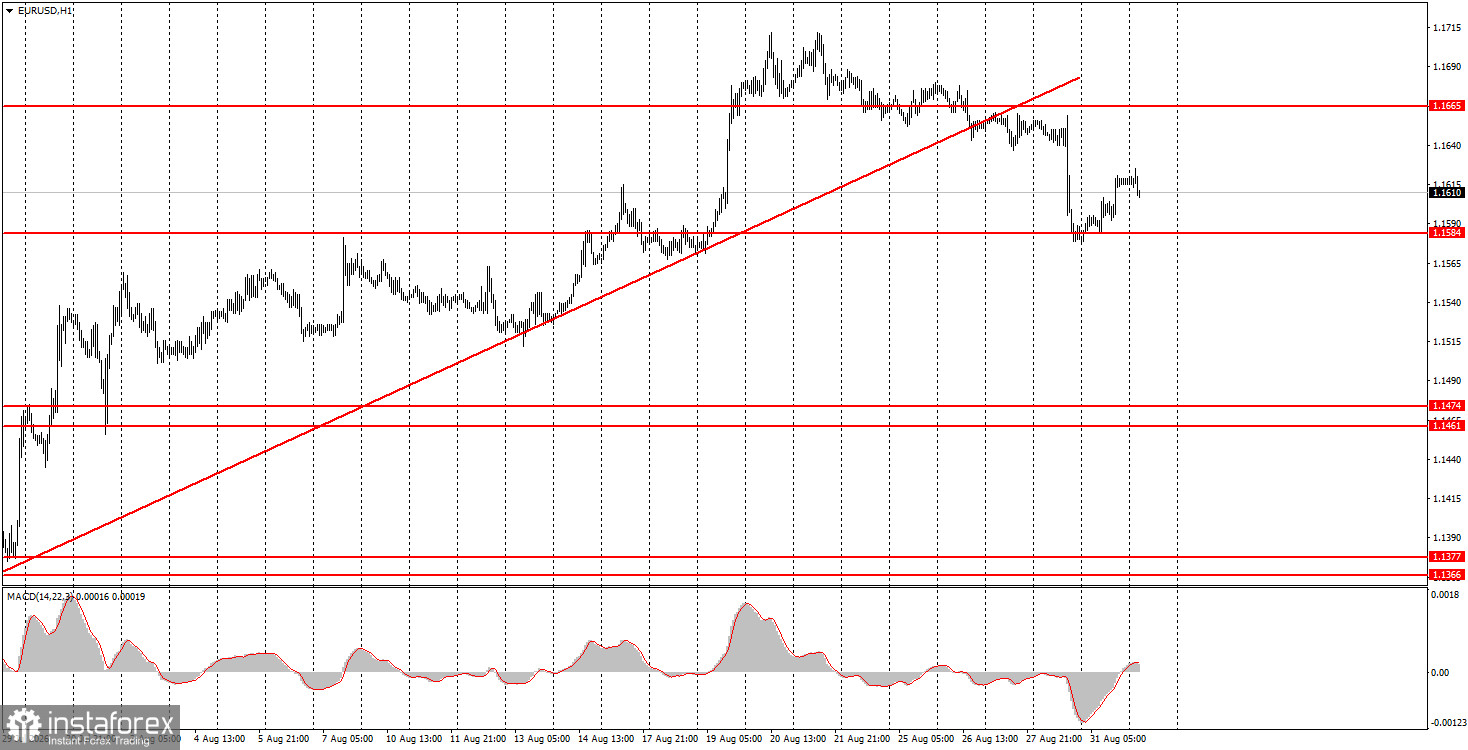
Menový pár EUR/USD nedokázal počas pondelkového obchodovania pokračovať v korekcii smerom nadol ani v trende, ktorý sa začal v piatok. Upozorňovali sme, že je nepravdepodobné, že v pondelok dôjde k výrazným pohybom. Makroekonomické pozadie bolo veľmi slabé a nedošlo k žiadnym ďalším významným udalostiam. Včera bola zverejnená len správa o augustovej inflácii v Nemecku, ktorá bola skôr sklamaním ako povzbudením. Inflácia síce vzrástla, avšak jej nárast bol nižší, než obchodníci očakávali. Na jednej strane teda s rastom inflácie stúpajú šance na druhé sprísnenie menovej politiky Európskej centrálnej banky. Tempo rastu inflácie však môže byť dostatočne nízke na to, aby podnietilo ECB k agresívnym krokom. V každom prípade sa konečné závery vyvodia až po dnešnom zverejnení údajov o inflácii v Európe. Je dôležité mať na pamäti, že Nemecko je len jednou z 27 krajín eurozóny. Inflácia v Nemecku preto nie je rozhodujúcim ukazovateľom. Tento týždeň bude v USA zverejnené množstvo dôležitých údajov, preto očakávame, že neskôr v týždni budú pohyby na trhu oveľa výraznejšie ako v pondelok.
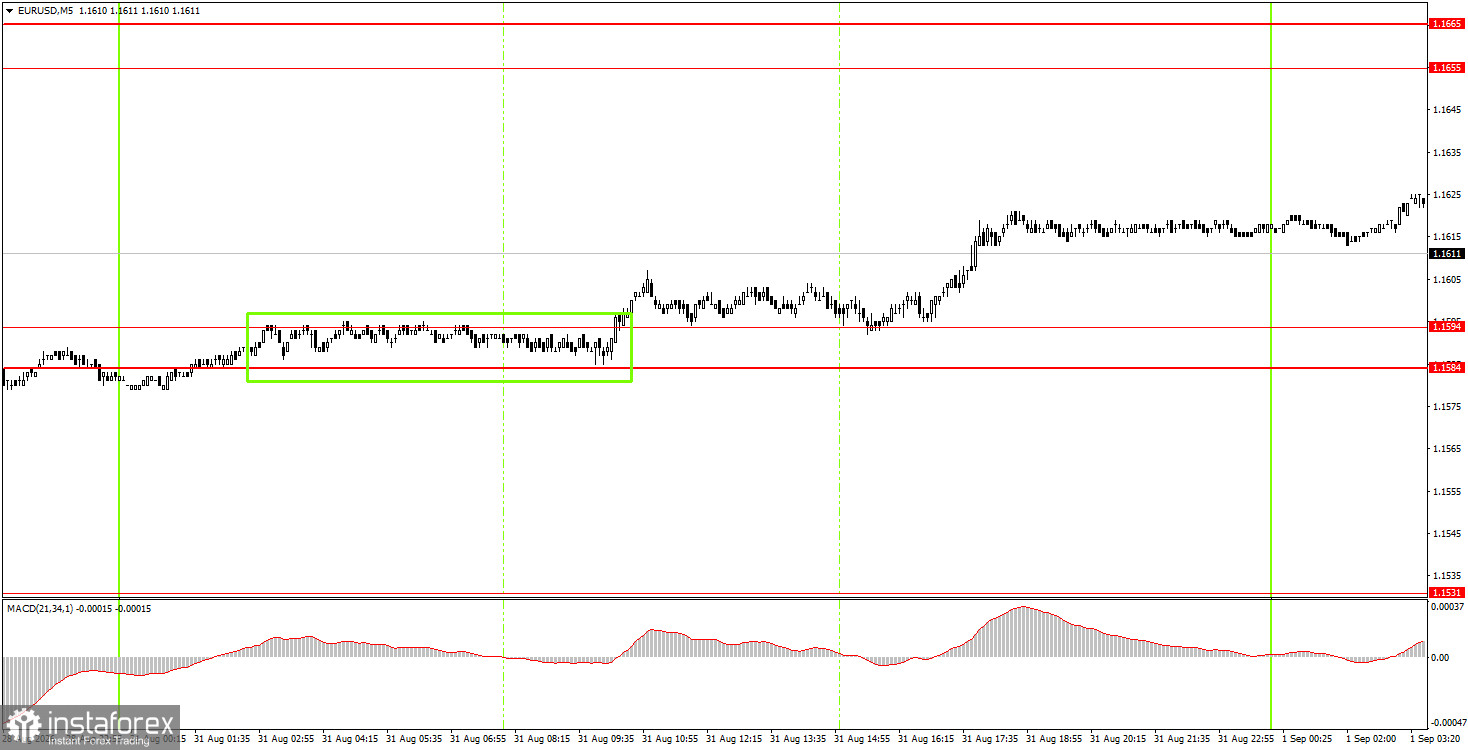
V pondelok sa na 5-minútovom grafe vytvoril jeden nákupný signál. Počas európskej obchodnej seansy sa cena odrazila od oblasti 1,1584 – 1,1594, čo umožnilo začínajúcim obchodníkom otvoriť relatívne jednoduchú a priamu nákupnú pozíciu. Rast eura dnes môže pokračovať, je však dôležité mať na pamäti makroekonomické udalosti, ktoré by mohli ovplyvniť pohyb tohto menového páru.
Na hodinovom grafe páru EUR/USD sa po mesiaci rastu začala korekcia. Vzhľadom na všetky nedávne udalosti posledných mesiacov sa domnievame, že európska mena by mala naďalej vykazovať stabilný rast aj bez podpory domácich údajov. V súčasnosti neexistujú žiadne faktory, ktoré by podporovali rast americkej meny, a preto naďalej očakávame posilňovanie tohto páru.
V utorok môžu začínajúci obchodníci zvážiť otvorenie krátkych pozícií s cieľom na úrovni 1,1527–1,1531, ak sa cena ustáli pod oblasťou úrovní 1,1584–1,1594. Dlhé pozície je možné otvoriť, ak sa cena odrazí od oblasti 1,1584–1,1594 s cieľom na úrovni 1,1655–1,1665.
Na 5-minútovom grafe môžu byť na obchodovanie použité tieto úrovne 1,1366–1,1377, 1,1461–1,1474, 1,1527–1,1531, 1,1584–1,1594, 1,1655–1,1665, 1,1745–1,1754 a 1,1830–1,1837. V utorok sa v eurozóne plánuje zverejnenie údajov o inflácii za august a v USA budú zverejnené aj správy JOLTS a ISM týkajúce sa výrobného sektora. Dá sa očakávať, že trh na tieto údaje zareaguje.
1. Sila signálu závisí od času, ktorý je potrebný na jeho vytvorenie (odraz alebo prelomenie). Čím rýchlejšie sa signál vytvorí, tým bude silnejší.
2. Ak sa na základe falošných signálov otvoria na určitej úrovni dva alebo viac obchodov, následné signály z tejto úrovne by sa mali ignorovať.
3. Na trhu bez jednoznačného trendu môže akýkoľvek menový pár vytvoriť viacero falošných signálov alebo žiadny signál. Technické úrovne možno ignorovať.
4. Obchodné hodiny: obchodné aktivity sa vykonávajú od začiatku európskej seansy do polovice americkej seansy, po ktorej by sa mali všetky otvorené obchody ručne zavrieť.
5. Na hodinovom grafe obchodujte na základe signálov MACD len vtedy, keď je volatilita dostatočná a trend je potvrdený trendovou líniou alebo kanálom.
6. Ak dve úrovne ležia tesne vedľa seba (v rozmedzí 5 až 20 pipov), mali by sa považovať za oblasť podpory alebo rezistencie.
Úrovne podpory a rezistencie slúžia ako cieľové úrovne pri nákupe alebo predaji, alebo ako zdroje signálov.
Červené čiary označujú kanály alebo trendové čiary, ktoré znázorňujú aktuálny trend a naznačujú očakávaný smer obchodovania.
Indikátor MACD (14,22,3) – histogram a signálna čiara – je doplnkový indikátor, ktorý možno tiež využiť ako zdroj signálov.
Dôležité prejavy a správy (obsiahnuté v kalendári správ) môžu výrazne ovplyvniť pohyb menového páru. Počas ich zverejnenia by ste mali zvýšiť opatrnosť alebo opustiť trh, aby ste sa vyhli náhlym cenovým obratom.
Začiatočníci, ktorí obchodujú na devízovom trhu, by si mali uvedomiť, že nie každý obchod môže byť ziskový. Vytvorenie jasnej stratégie a dodržiavanie zásad riadenia kapitálu sú kľúčom k dlhodobému úspechu v obchodovaní.
InstaForex analytical reviews will make you fully aware of market trends! Being an InstaForex client, you are provided with a large number of free services for efficient trading.


