 Zostať
Podmienky obchodovania
Nástroje



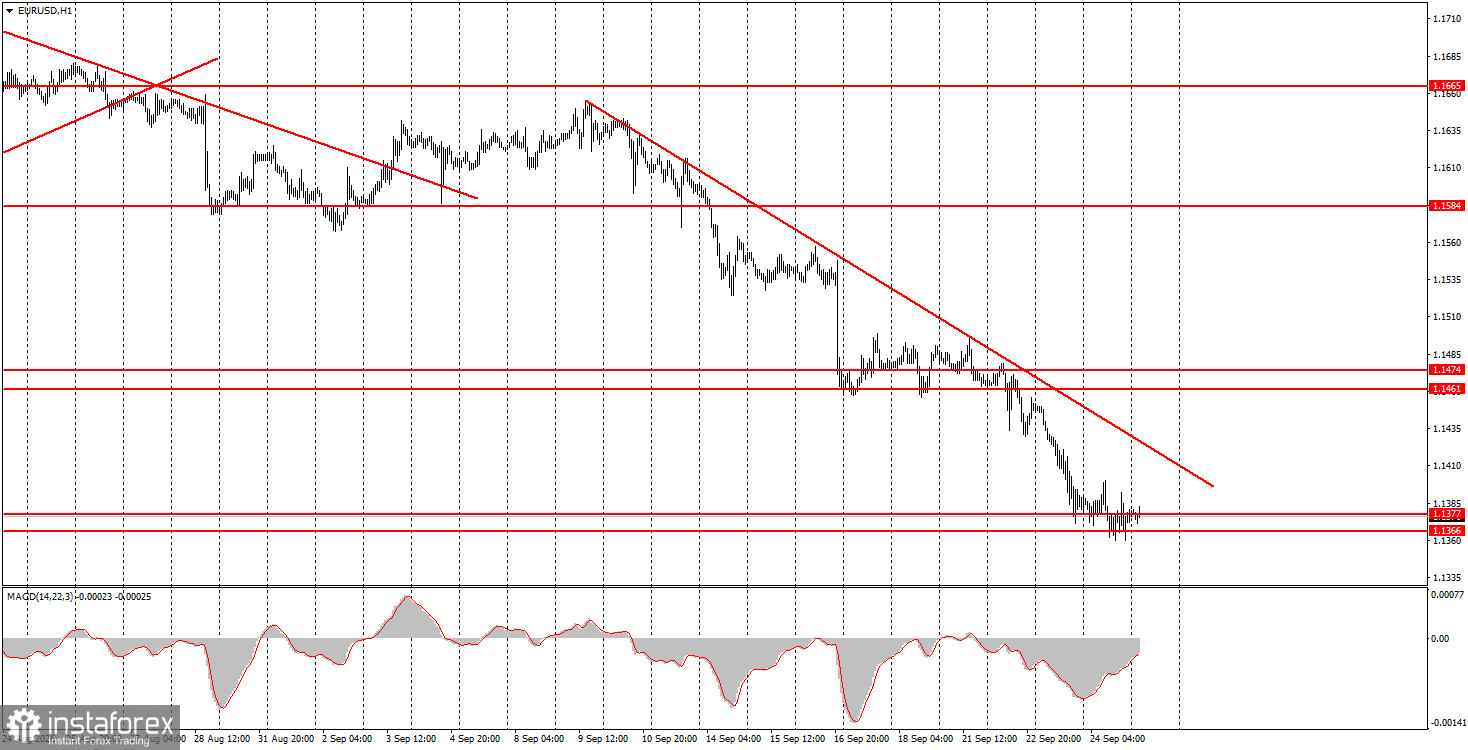
The EUR/USD pair on Thursday continued its downward movement, which by now is unlikely to surprise anyone. The US dollar has been rising for three weeks straight—if not every day, then almost every day. Yesterday there were no important macroeconomic releases in either the eurozone or the US, so we can draw the same conclusion as before: the current downward move is inertial and illogical. In short, the dollar is rising out of inertia rather than for any specific reasons. We believe even novice traders understand that for three weeks the market cannot keep pricing Federal Reserve tightening while simultaneously ignoring, for example, European Central Bank rate hikes. Also note that talks between the US and Iran have resumed in recent days. Of course, the probability of a deal between Tehran and Washington in the near term remains low, but it is nonetheless a step toward peace, which should reduce the dollar's appeal as a safe-haven asset. Nevertheless, the dollar continues to rise, paying no attention to any of this.
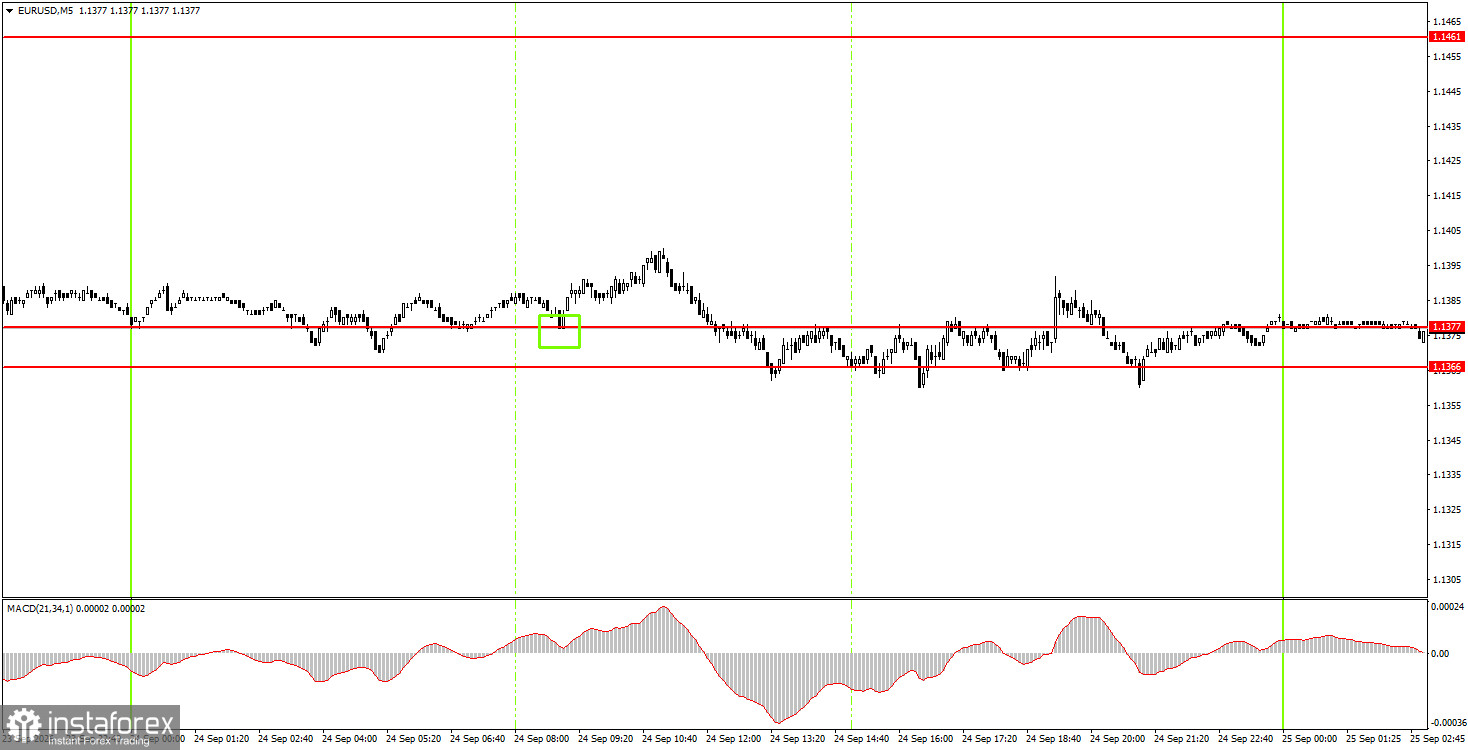
On the 5-minute TF on Thursday, it is clear that price spent almost the entire day moving sideways along the 1.1366–1.1377 support area. Formally, one buy signal was formed, but it yielded no profit. Today you can continue trading from the 1.1366–1.1377 area.
On the hourly timeframe, EUR/USD continues a downward trend that is now a full-fledged trend. Considering all events of recent months, we do not believe the euro should be plunging like a stone. But for the market, the Fed's monetary policy remains the top priority and has become much more favorable to the US currency. The market ignores other factors.
On Friday, novice traders can open short positions with a target of 1.1267–1.1275 if price consolidates below the 1.1366–1.1377 area. Open long positions targeting 1.1461–1.1474 if price rebounds from the 1.1366–1.1377 area.
On the 5-minute TF, consider the levels 1.1267–1.1275, 1.1366–1.1377, 1.1461–1.1474, 1.1527–1.1531, 1.1584–1.1594, 1.1655–1.1665, 1.1745–1.1754. On Friday, the US will release the durable goods orders report, the most important event of the day and likely to provoke a market reaction. All other reports and events are secondary.
Price levels (areas) of support and resistance serve as targets for opening buy or sell trades or as sources of signals.
Red lines indicate channels or trend lines that show the current trend and the preferred trading direction.
The MACD indicator (14,22,3) — the histogram and signal line — is an auxiliary indicator that can also provide signals.
Important speeches and reports (listed in the news calendar) can significantly influence currency pair movements. Therefore, during their release, traders should approach trading with utmost caution, or exit the market to avoid sudden reversals against the preceding move.
Beginner forex traders should remember that not every trade can be profitable. Developing a clear strategy and practicing money management are key to long-term success in trading.
InstaForex analytical reviews will make you fully aware of market trends! Being an InstaForex client, you are provided with a large number of free services for efficient trading.


