 Zostať

Podmienky obchodovania
Nástroje


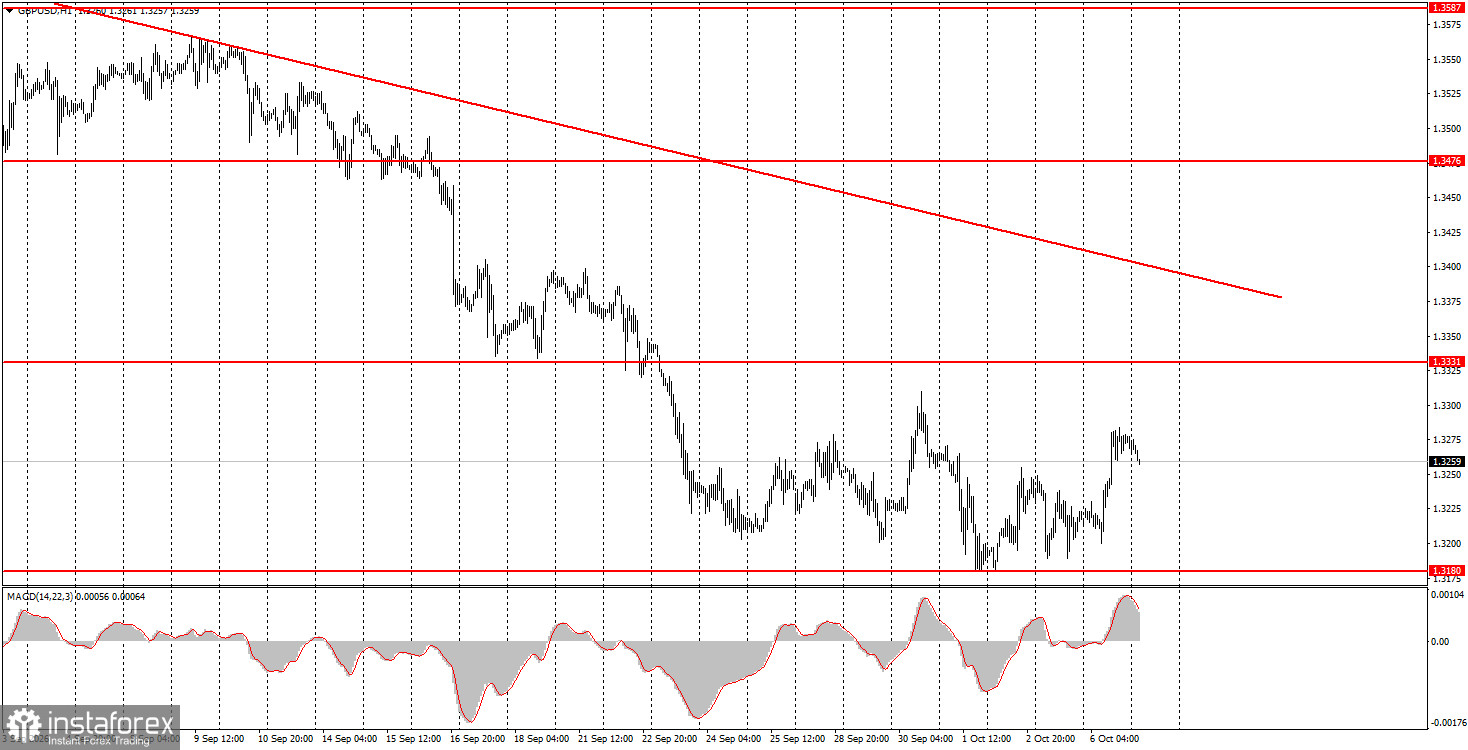
The GBP/USD pair also showed upward movement on Tuesday, although no local fundamentals justified it. Still, like the euro, the pound has generally fallen or stayed flat. Over the past two weeks, the pound has mostly been flat, which can already be counted as a small victory. One very important point: on the weekly timeframe, GBP/USD sits near the lower boundary of the year-long sideways channel. Therefore, very strong reasons would be needed for price to break below that boundary — roughly the 1.3150 area. Conversely, the chance of a reversal at the lower boundary and a move to the upper boundary remains high. The market can, of course, keep buying the dollar aggressively for any reason, but looking at fundamentals, macro, geopolitics, and technicals, we see no reasons for further dollar strength. On Tuesday, there was no important UK or US data or news.
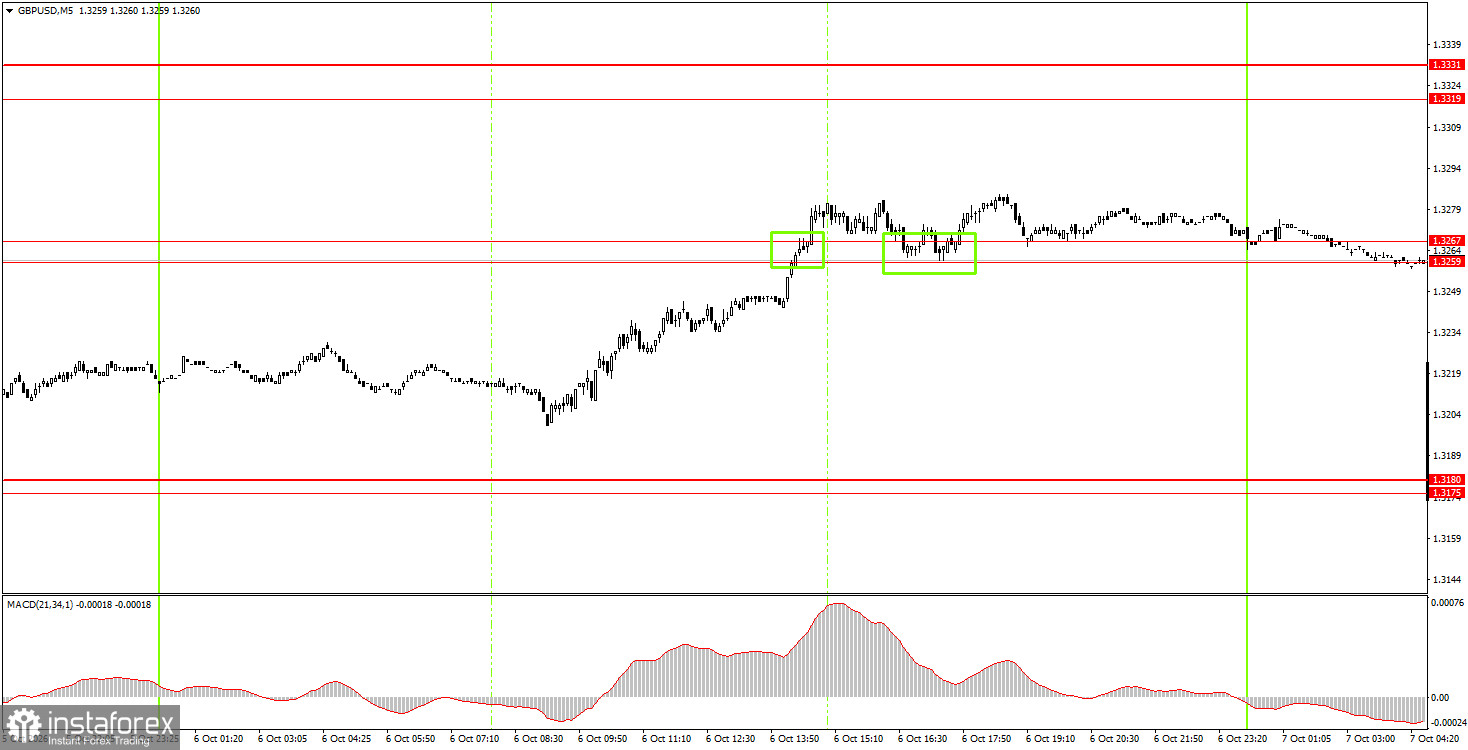
On the 5-minute TF on Tuesday, two buy signals were generated. Price first broke above the 1.3259–1.3267 area and then pulled back to it from above. The move did not develop into a sustained rally, but the buy signals are not yet invalidated.
On the hourly TF, GBP/USD continues a downward trend that has become a full-fledged, powerful move. The fundamental backdrop for the dollar improved because the Federal Reserve signaled it was ready to continue tightening monetary policy. However, three weeks have passed since then, and the market still buys the dollar aggressively. Therefore, we strongly doubt Fed policy alone explains this. We view the current move as illogical, inertia-driven, and speculative.
On Wednesday, novice traders can consider short positions targeting 1.3175–1.3180 if price consolidates below the 1.3259–1.3267 area. Open long positions targeting 1.3319–1.3331 if price rebounds from 1.3259–1.3267.
On the 5-minute TF you can trade the levels 1.3043, 1.3096–1.3107, 1.3175–1.3180, 1.3259–1.3267, 1.3319–1.3331, 1.3380–1.3386, 1.3456–1.3476, 1.3587–1.3598, 1.3631–1.3641. No important events are scheduled in the UK on Wednesday, while the US will publish the minutes of the last Fed meeting — an event that can be treated as a formality. However, lately the market either ignores most macro and fundamental releases or interprets them predominantly in favor of the dollar.
Price levels (areas) of support and resistance serve as targets for opening buy or sell trades or as sources of signals.
Red lines indicate channels or trend lines that show the current trend and the preferred trading direction.
The MACD indicator (14,22,3) — the histogram and signal line — is an auxiliary indicator that can also provide signals.
Important speeches and reports (listed in the news calendar) can significantly influence currency pair movements. Therefore, during their release, traders should approach trading with utmost caution, or exit the market to avoid sudden reversals against the preceding move.
Beginner forex traders should remember that not every trade can be profitable. Developing a clear strategy and practicing money management are key to long-term success in trading.
InstaForex analytical reviews will make you fully aware of market trends! Being an InstaForex client, you are provided with a large number of free services for efficient trading.


