 Zostať

Podmienky obchodovania
Nástroje


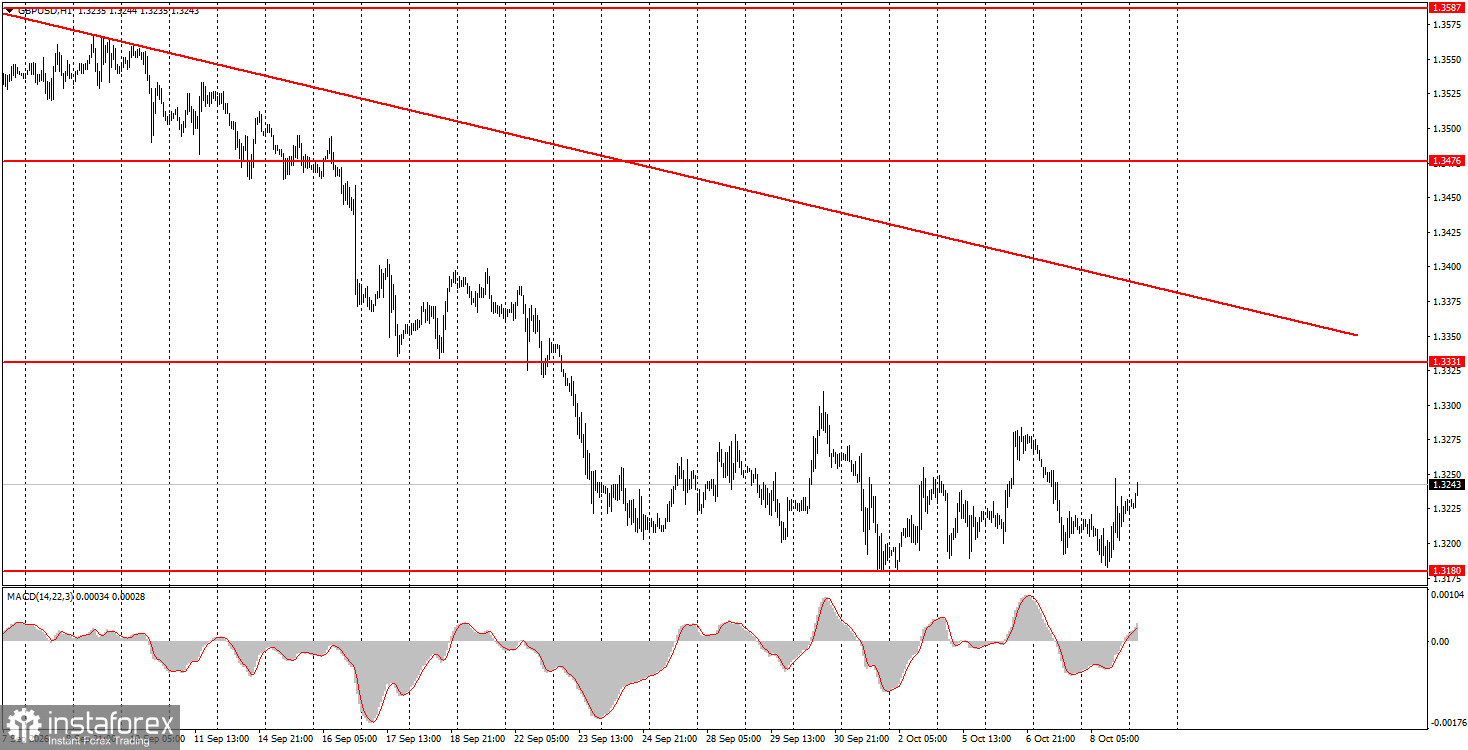
The GBP/USD pair traded inside a sideways channel on Thursday, clearly visible on the hourly chart. The key point is not just the hourly flat, but that there are three sideways channels at once — on the hourly, daily, and weekly charts — sharing a common lower boundary in the 1.3150–1.3180 area. As a result, the pound is trading in a key zone. A bounce from that area is likely, but many traders' Stop-Loss orders sit below it. That makes a liquidity sweep of recent lows likely—plenty of such lows have accumulated over the past year. Yesterday, there were no material releases in the UK or the US, and the pound has resisted market pressure for over two weeks. We have not seen convincing reasons for further dollar strength; indeed, the market has already priced in many positive factors for the dollar well in advance.
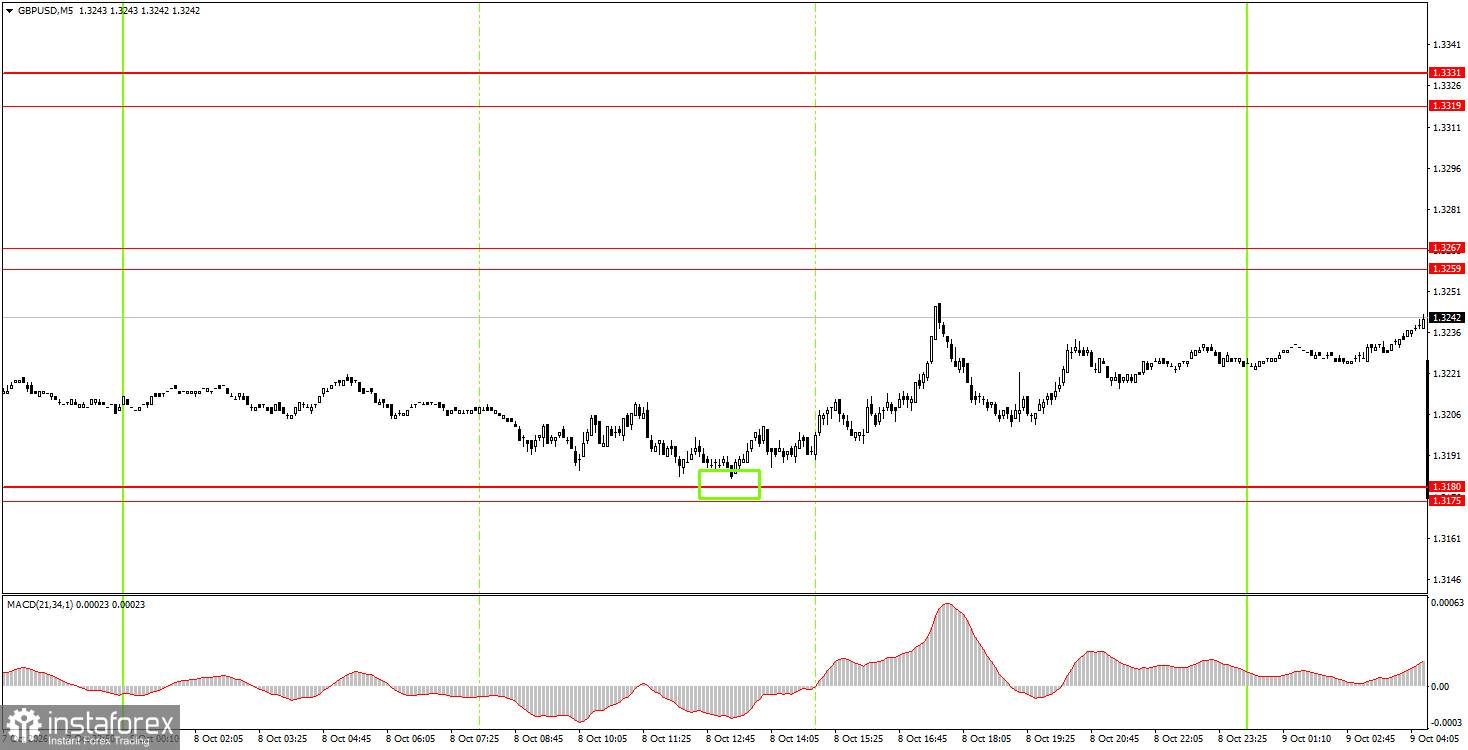
On the 5-minute TF on Thursday, one very good buy signal formed. During the European session, price bounced from the 1.3175–1.3180 area and then moved up about 30–40 pips. Traders could have taken profit on that trade on Thursday evening or left it open and moved the Stop Loss.
On the hourly TF, GBP/USD continues a downward trend that has become a full-fledged, powerful move. The fundamental backdrop for the dollar improved because the Federal Reserve signaled it was ready to continue tightening monetary policy. However, three weeks have passed since then, and the market still aggressively buys the dollar. Therefore, we strongly doubt that Fed policy alone explains this. We view the current move as illogical, driven by inertia, and speculative.
On Friday, novice traders can consider short positions targeting 1.3175–1.3180 if price rebounds from the 1.3259–1.3267 area. Open long positions targeting 1.3319–1.3331 if price breaks above 1.3259–1.3267.
On the 5-minute TF you can trade the levels 1.3043, 1.3096–1.3107, 1.3175–1.3180, 1.3259–1.3267, 1.3319–1.3331, 1.3380–1.3386, 1.3456–1.3476, 1.3587–1.3598, 1.3631–1.3641. The UK economic calendar is again empty on Friday, and the US will release the University of Michigan consumer-sentiment index — a report that, in the current environment, is unlikely to change trader sentiment or the overall technical picture.
Price levels (areas) of support and resistance serve as targets for opening buy or sell trades or as sources of signals.
Red lines indicate channels or trend lines that show the current trend and the preferred trading direction.
The MACD indicator (14,22,3) — the histogram and signal line — is an auxiliary indicator that can also provide signals.
Important speeches and reports (listed in the news calendar) can significantly influence currency pair movements. Therefore, during their release, traders should approach trading with utmost caution, or exit the market to avoid sudden reversals against the preceding move.
Beginner forex traders should remember that not every trade can be profitable. Developing a clear strategy and practicing money management are key to long-term success in trading.
InstaForex analytical reviews will make you fully aware of market trends! Being an InstaForex client, you are provided with a large number of free services for efficient trading.


