 Zostať

Podmienky obchodovania
Nástroje


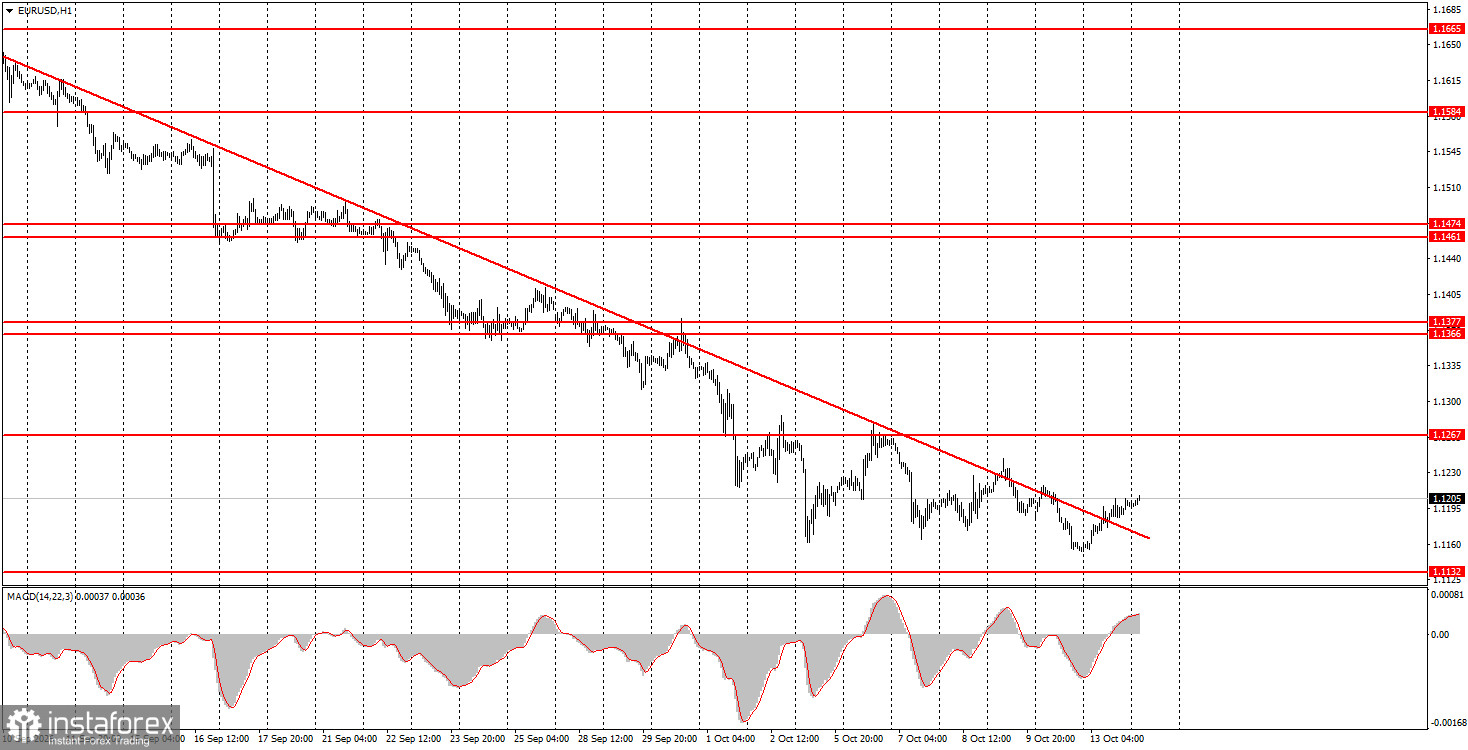
On Tuesday, the EUR/USD pair made another tepid attempt to correct within the month-long decline. Price has once again broken the descending trendline, yet each breakout fails to produce either a rebound or sustained gains. In short, price ignores an important technical reference like the trendline. Moreover, traders are ignoring more than just the trendline: they are also ignoring macroeconomic, fundamental, and geopolitical factors, or at least interpreting them only in favor of the dollar. Formally, the downtrend may look finished, but in practice the pair's decline can resume at any moment for any reason. For example, today the US inflation report will be released, and traders may interpret it as raising the odds of more hawkish Federal Reserve action before year-end. And what the report shows may not even matter: if inflation is above forecasts, the dollar will likely rise with about 90% probability; if not, that could indirectly signal the end of the US currency's "story."
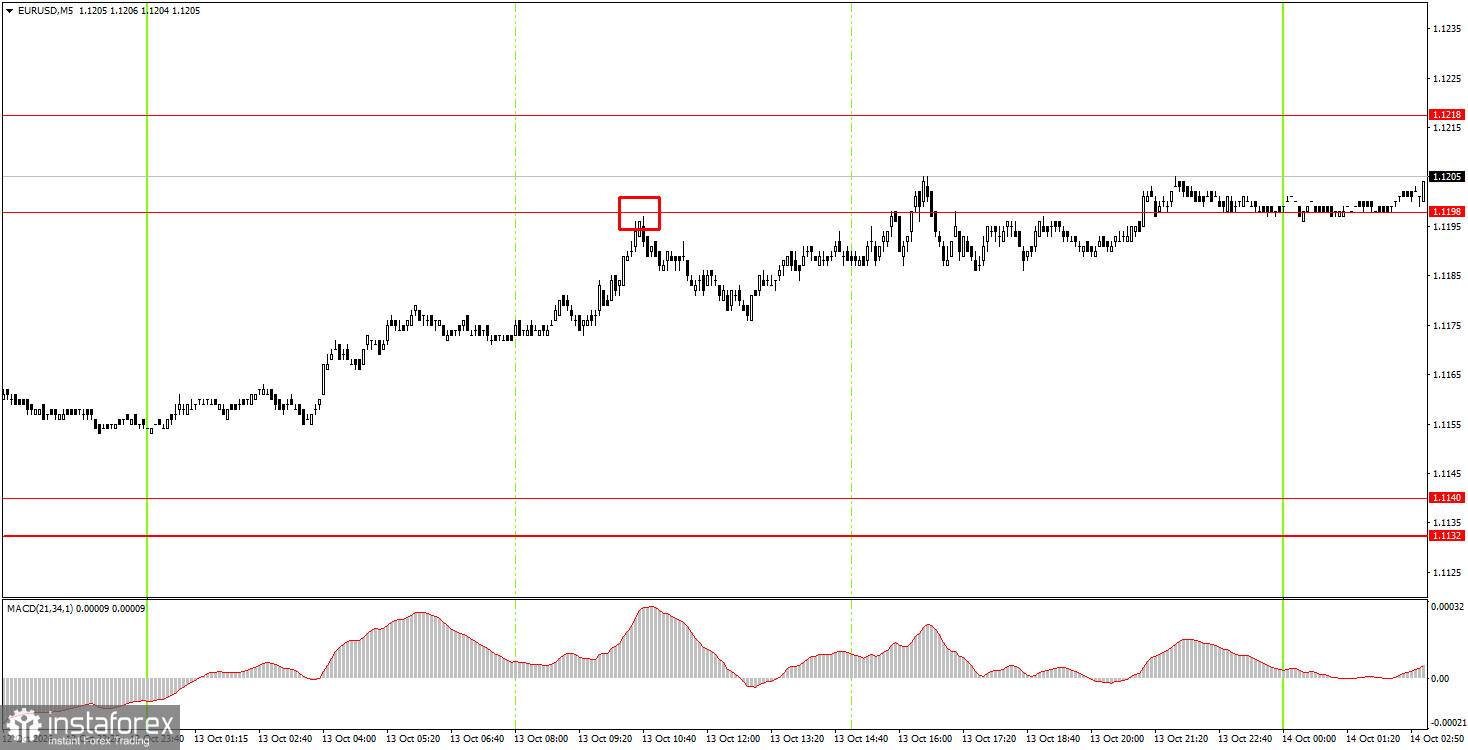
On the 5-minute timeframe on Tuesday, one sell signal was generated, but it produced no profit for novice traders. Price rebounded from the 1.1198 level during the European session, but moved down only about 15 pips—just enough to move the Stop Loss to breakeven.
On the hourly timeframe, EUR/USD continues a downward trend that qualifies as a full trend. Considering events of recent months, we do not believe the euro should be collapsing like a stone. Yet the market keeps buying the US dollar, ignoring events, releases, and even technical factors.
On Wednesday, novice traders may consider new short positions on a rebound from the 1.1198–1.1218 area, targeting 1.1132–1.1140. Open long positions on a close above the 1.1198–1.1218 area, targeting 1.1267–1.1275.
On the 5-minute timeframe consider the levels 1.1011, 1.1088, 1.1132–1.1140, 1.1198–1.1218, 1.1267–1.1275, 1.1366–1.1377, 1.1461–1.1474, 1.1527–1.1531, 1.1584–1.1594, 1.1655–1.1665. On Wednesday, the US will publish the inflation report, and European Central Bank President Christine Lagarde will give two speeches in the Eurozone. Expect Lagarde to offer further comments on monetary policy — but what weight will they carry if the ECB is tightening while the euro keeps falling? Thus, the main focus remains on the inflation report.
Price levels (areas) of support and resistance serve as targets for opening buy or sell trades or as sources of signals.
Red lines indicate channels or trend lines that show the current trend and the preferred trading direction.
The MACD indicator (14,22,3) — the histogram and signal line — is an auxiliary indicator that can also provide signals.
Important speeches and reports (listed in the news calendar) can significantly influence currency pair movements. Therefore, during their release, traders should approach trading with utmost caution, or exit the market to avoid sudden reversals against the preceding move.
Beginner forex traders should remember that not every trade can be profitable. Developing a clear strategy and practicing money management are key to long-term success in trading.
InstaForex analytical reviews will make you fully aware of market trends! Being an InstaForex client, you are provided with a large number of free services for efficient trading.


