 Zostať


Podmienky obchodovania
Nástroje


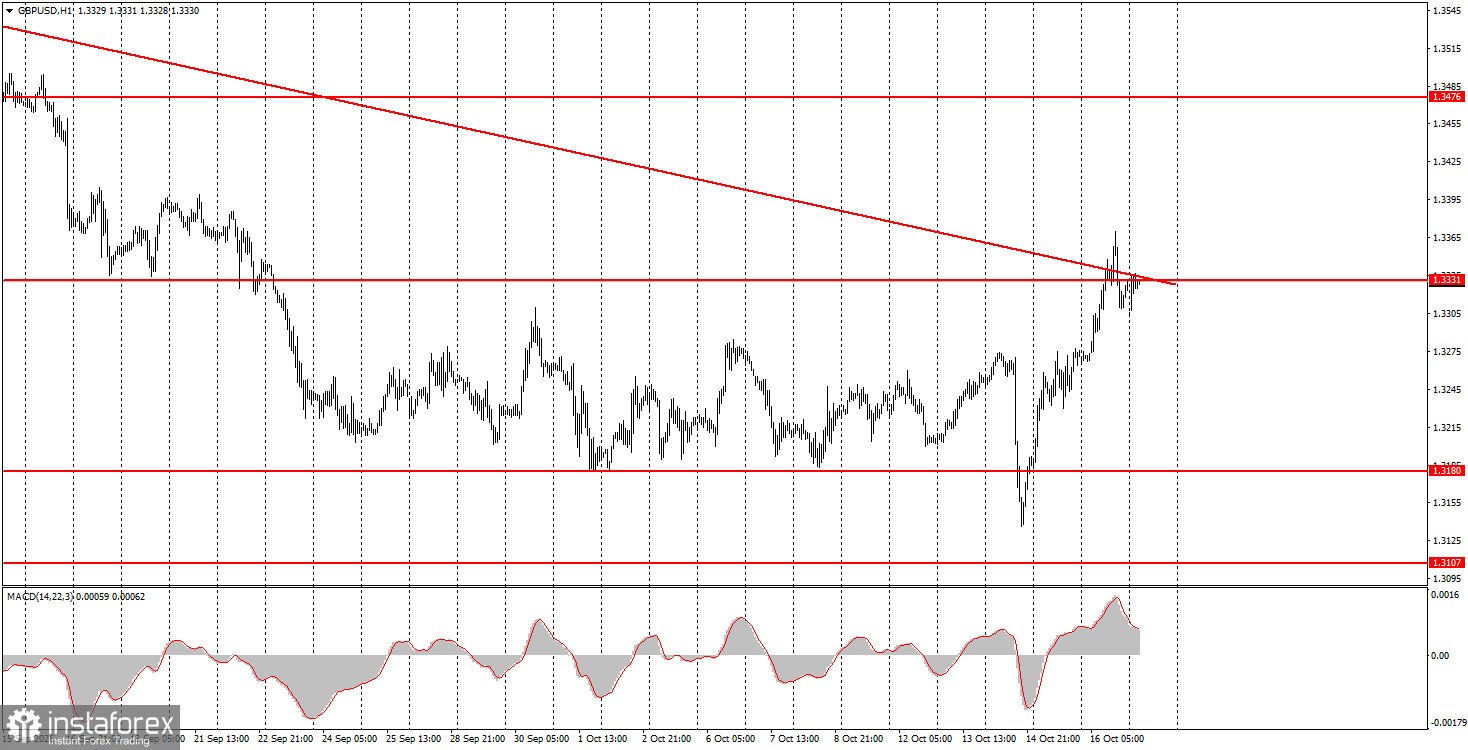
GBP/USD extended its rally on Friday, largely driven by Kevin Warsh's speech overnight, in which he offered no indication that the Federal Reserve would hike more aggressively than previously expected. Last week's US inflation reports surprised to the upside and prompted the market to price in more aggressive Fed tightening. Warsh's comments, however, did not signal additional tightening, and in our view the dollar has exhausted many of its bullish drivers. Technically, charts across timeframes now support further upside. Sterling spent three weeks flat on the hourly chart and has traded within sideways channels on the daily and weekly charts for about a year. The bounce that removed liquidity from the lower edge of all three channels triggered the rally, which could mark the start of a longer-lasting uptrend.
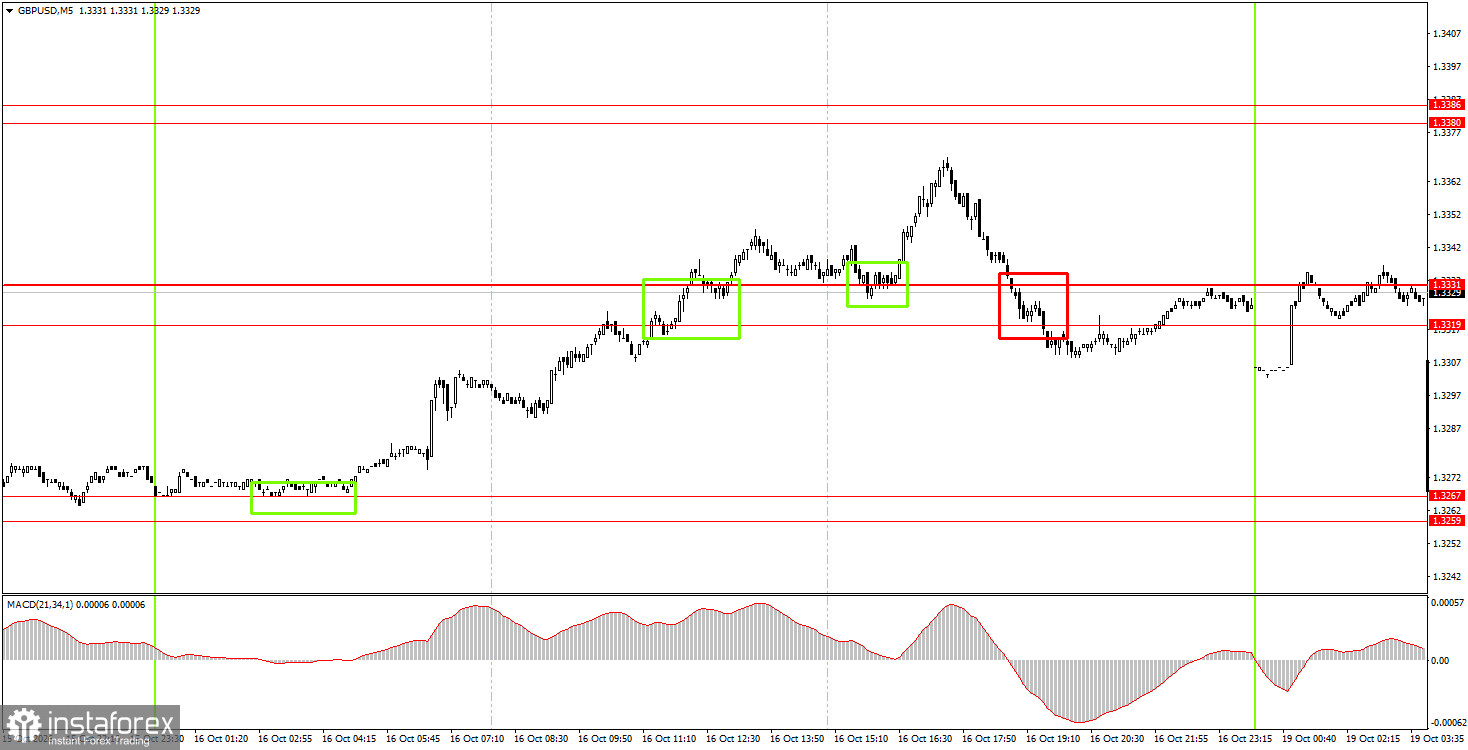
On the 5-minute chart, Friday produced four trading signals. Overnight, the pair bounced from the 1.3259–1.3267 area, allowing overnight traders to open long positions. In the first half of the day, price cleared the 1.3319–1.3331 zone and then pulled back from it, again offering longs. Toward the end of the day, the pair closed below 1.3319–1.3331, but that late signal was unlikely to be tradable because the market was closing within a few hours.
On the hourly timeframe, GBP/USD has a good chance of completing the month-long downtrend. The pound has shown notable resilience against the dollar in recent weeks and now has a strong chance of entering an uptrend. The technical picture on most charts supports sterling's rise. Fundamental and macro conditions, along with a heavily overbought dollar, also favor upside in GBP/USD.
On Monday, novice traders may consider short positions targeting 1.3259–1.3267 if price closes below the 1.3319–1.3331 area. Consider long positions with a target of 1.3380–1.3386 if price closes above the 1.3319–1.3331 area.
On the 5-minute timeframe watch these levels: 1.3043, 1.3096–1.3107, 1.3175–1.3180, 1.3259–1.3267, 1.3319–1.3331, 1.3380–1.3386, 1.3456–1.3476, 1.3587–1.3598, 1.3631–1.3641. No major UK or US releases are scheduled for Monday, so traders will have little to react to during the day. Volatility may be low, but the pound is likely to remain biased toward further gains.
Price levels (areas) of support and resistance serve as targets for opening buy or sell trades or as sources of signals.
Red lines indicate channels or trend lines that show the current trend and the preferred trading direction.
The MACD indicator (14,22,3) — the histogram and signal line — is an auxiliary indicator that can also provide signals.
Important speeches and reports (listed in the news calendar) can significantly influence currency pair movements. Therefore, during their release, traders should approach trading with utmost caution, or exit the market to avoid sudden reversals against the preceding move.
Beginner forex traders should remember that not every trade can be profitable. Developing a clear strategy and practicing money management are key to long-term success in trading.
InstaForex analytical reviews will make you fully aware of market trends! Being an InstaForex client, you are provided with a large number of free services for efficient trading.


