 Zostať
Podmienky obchodovania
Nástroje


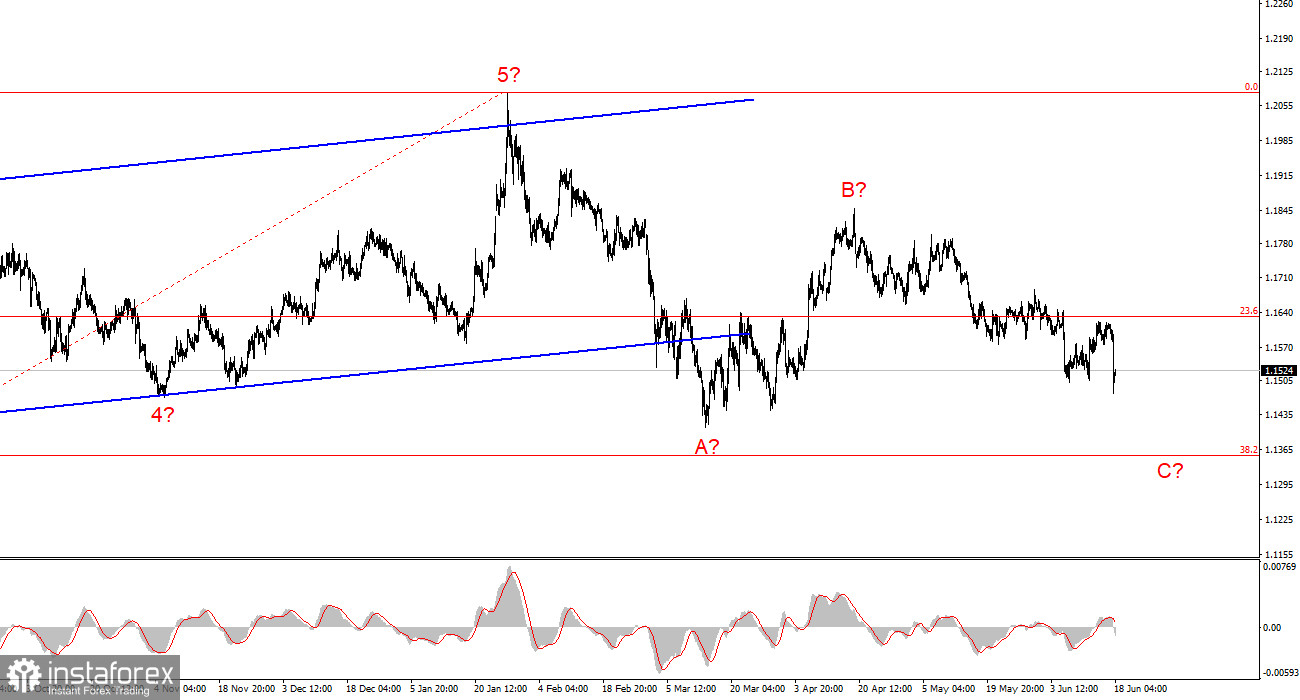
The wave pattern on the 4-hour chart for EUR/USD has taken on a fairly clear shape. There is still no reason to consider the upward trend segment (lower chart), which began in January of last year, canceled. However, the trend structure has now assumed a corrective form. From a long-term perspective, a wave C formation can be expected, with its low positioned below the low of wave A. At the moment, it is difficult to believe in such a strong decline of the euro, as the conflict in the Middle East is approaching its conclusion and the U.S. dollar lacks other significant supporting factors. Therefore, the expected wave C may turn out to be truncated.
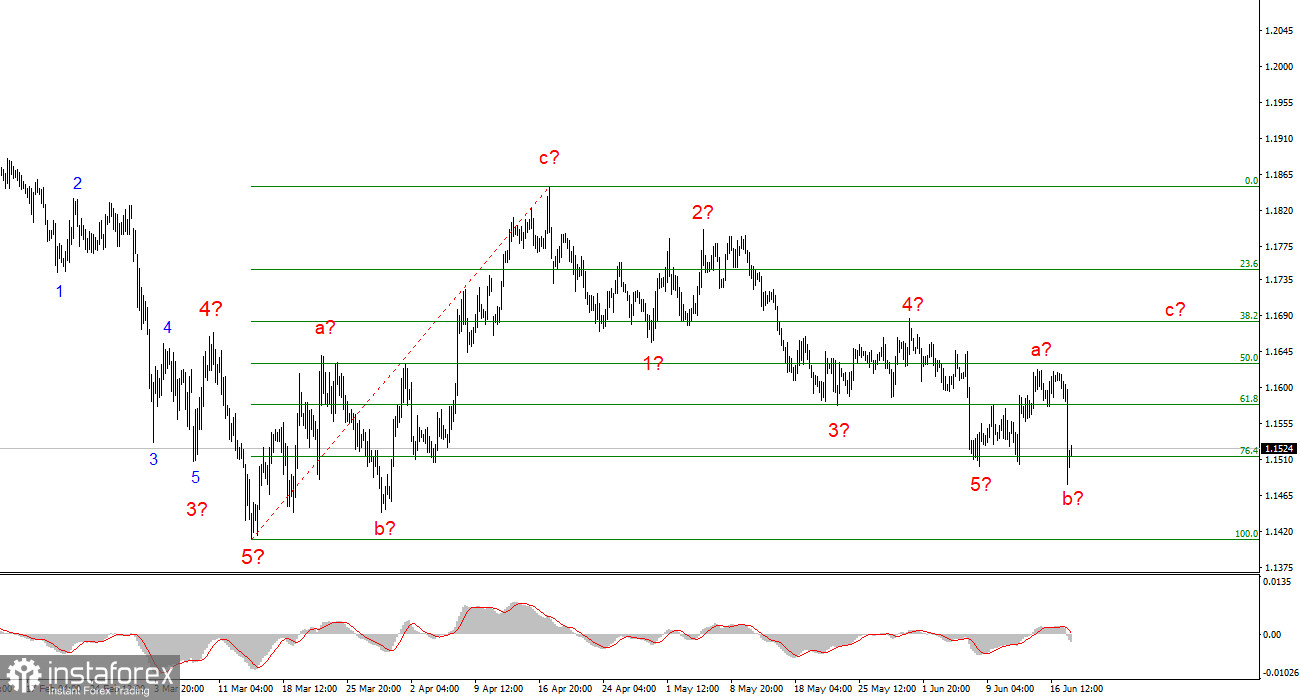
On the lower time frame, I can identify a classic five-wave bearish structure. Once this structure is completed, the pair may transition to an upward wave sequence. Therefore, from the 1.1513 level, which corresponds to the 76.4% Fibonacci retracement, at least a corrective wave structure can be expected. However, without support from geopolitical factors, the euro cannot count on favorable market sentiment.
The EUR/USD pair declined by 100 basis points on Wednesday, while the intraday trading range was approximately 70 points. Undoubtedly, most of the U.S. dollar's gains occurred during the two hours immediately following the Federal Reserve meeting. I cannot say that the outcome of the FOMC meeting surprised me, but compared with the previous two meetings, the changes in the monetary policy outlook were substantial.
Let me remind you that the dot plot is published every second meeting and reflects Federal Reserve policymakers' expectations regarding interest rates over the next several years. The latest dot plot was released in March, and at that time none of the policymakers expected a rate hike. Now, however, half of the FOMC expects at least one round of policy tightening, while six policymakers anticipate two or more. Interestingly, Kevin Warsh declined to provide his rate forecast and generally opposes the publication of the dot plot, arguing that these projections force the market to expect a specific path of monetary policy adjustments from the Federal Reserve. Therefore, it is possible that we are seeing one of the final editions of the dot plot.
As the Federal Reserve's stance has become significantly more hawkish, the market responded by increasing demand for the U.S. dollar. However, in my view, the only thing that changed yesterday was the wave structure, which now points more toward the development of a corrective wave sequence. In the near term, I still expect the pair to rise toward the 1.1700 level or slightly higher amid the de-escalation of the conflict in the Middle East.
The Fed's stance has become more hawkish, but the European Central Bank is also moving toward higher interest rates and already conducted its first round of tightening last week. Since both central banks are targeting tighter monetary policy in 2026, I do not see a strong advantage for the dollar in its current confrontation with the euro.
Based on the EUR/USD analysis, I conclude that the pair remains within an upward trend segment (lower chart) and, in the shorter term, within a downward trend segment that may already be complete. In my view, this is a favorable time to consider forming long positions. An unsuccessful attempt to break below the 1.1513 level, corresponding to the 76.4% Fibonacci retracement, combined with the completed appearance of the downward trend segment, suggests that the pair may transition to an upward wave sequence with targets located around the 1.1700 level and higher.
On the higher time frame, an upward trend segment remains visible, followed by the development of a corrective wave structure. In the near future, wave C is expected to form with targets near the 1.1352 level, which corresponds to the 38.2% Fibonacci retracement. Once the A-B-C structure is completed, a new long-term upward trend may begin.
Key Principles of My Analysis:
InstaForex analytical reviews will make you fully aware of market trends! Being an InstaForex client, you are provided with a large number of free services for efficient trading.


