 Zostať
Podmienky obchodovania
Nástroje


The market has grown tired of the Magnificent Seven, yet the peaceful handover is accompanied by doubts about the chosen course. Investors are betting on a Goldilocks regime — the economy still strong, albeit slowing, inflation growth easing, and the Fed cutting rates. As soon as that scheme starts to falter, rotation stalls, and the S&P 500 pulls back.
Will the US equity market crash in 2026? That's the million?dollar question. If roulette lands on red three times in a row, a bet on black on the next spin looks appealing. The S&P 500 has risen for three consecutive years, and on the previous two occasions, the fourth year brought a pullback in the broad stock index.
S&P 500 Drawdown Dynamics
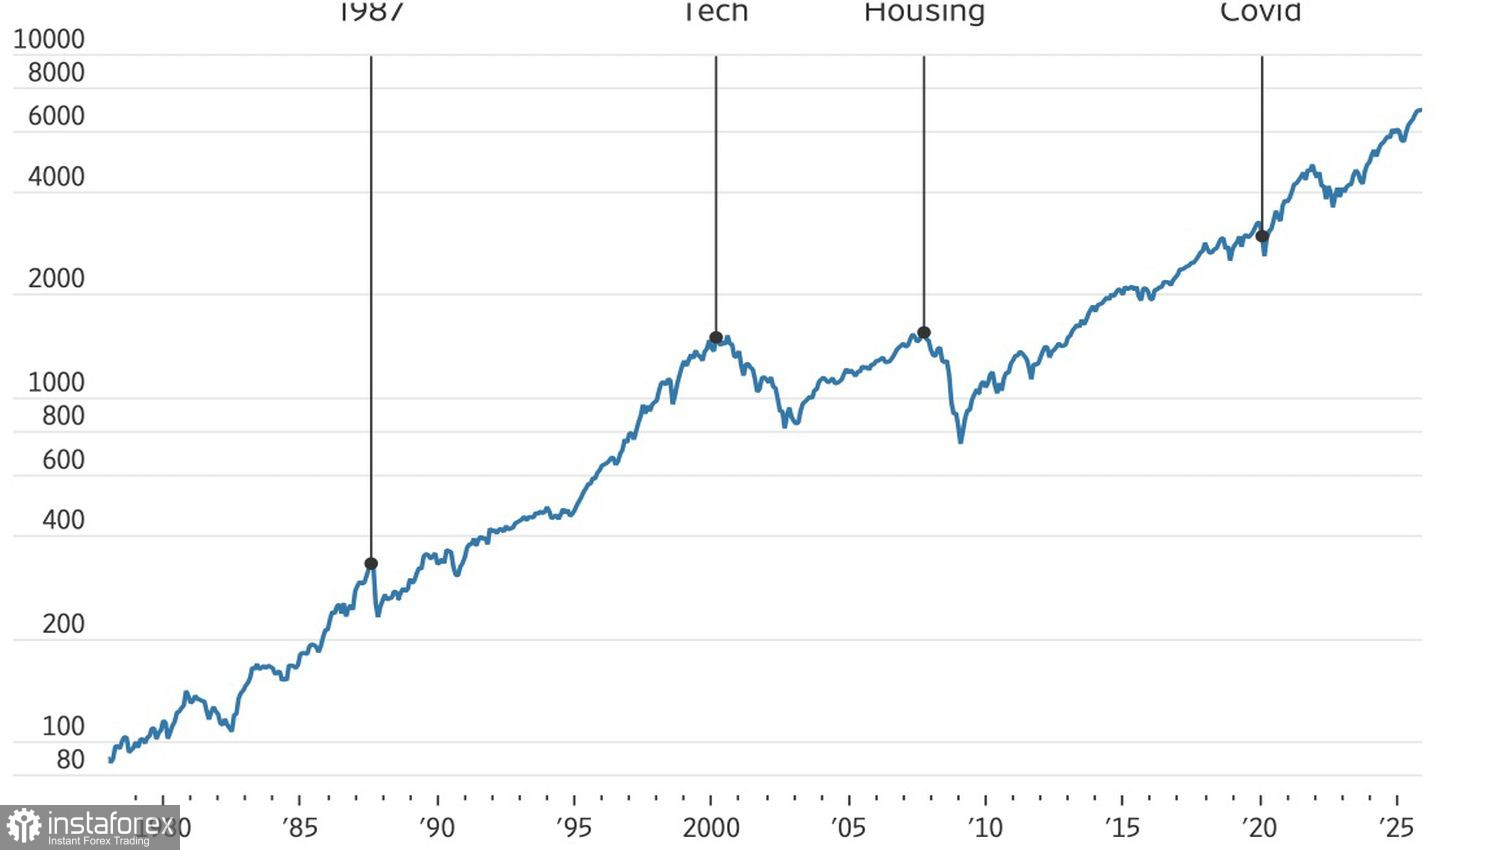
Stock market crashes are like earthquakes: rare and impossible to predict. Still, people inevitably listen to oracles who claim to feel the tremors. Surveys conducted by Elm Wealth and Yale University put the probability of an S&P 500 crash of 30% or more within the next 12 months at 30–31%. Judging by the futures market, this figure is too high.
Derivatives price the chances of a substantial S&P 500 drawdown in 2026 at 8%. TS Lombard concurs, putting the probability at 8–10%. The firm argues that crashes occur on average once every 10–12 years. The last one took place in 2020 during the pandemic. So no need to panic?
In reality, rotation — reducing the weight of tech names in portfolios and increasing exposure to economically sensitive stocks — is not a one?day process. It takes months. During this period, concentration in the S&P 500 will remain high, so trouble at any one of the Magnificent Seven can cause pronounced swings in the broad index.
Capital Flows into ETFs Excluding Magnificent Seven
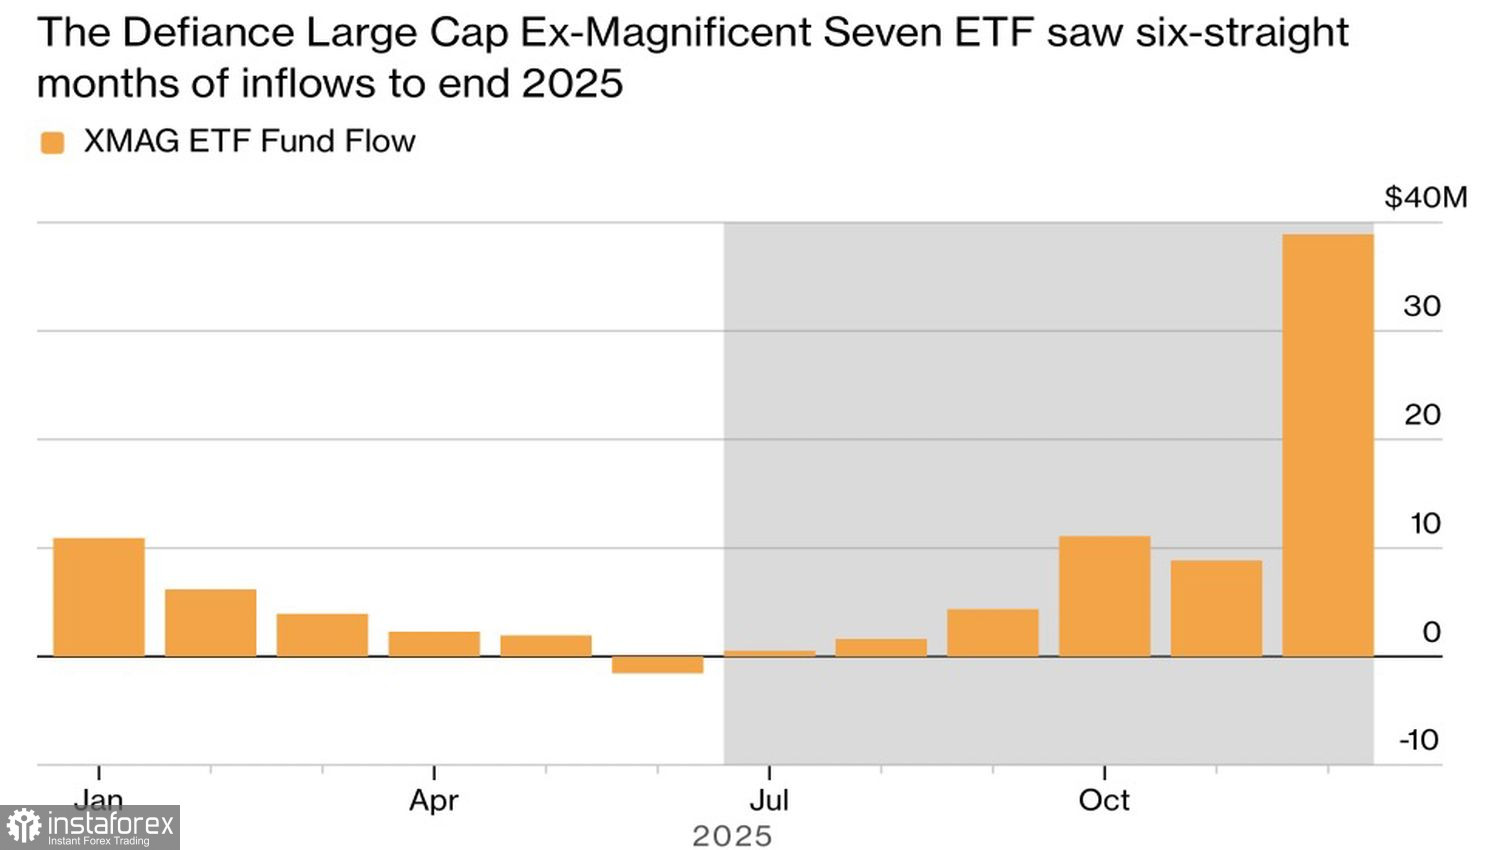
The situation painfully resembles the dot?com crisis, when a handful of Internet companies failed to generate returns adequate to the capital invested. History repeats. Will it do so again in 2026?
For now, the market is recovering amid geopolitical shocks and closely reacting to macro prints to determine whether the Fed will cut rates this spring. In this context, a surge in services activity to a 14?month high and ADP's private?sector employment increase of 41,000 in December were catalysts for a sell-off in the broad index. It fell along with the odds of a March easing. Derivatives now price those odds at 45%. At the start of the week, on December 9, they were 51%.
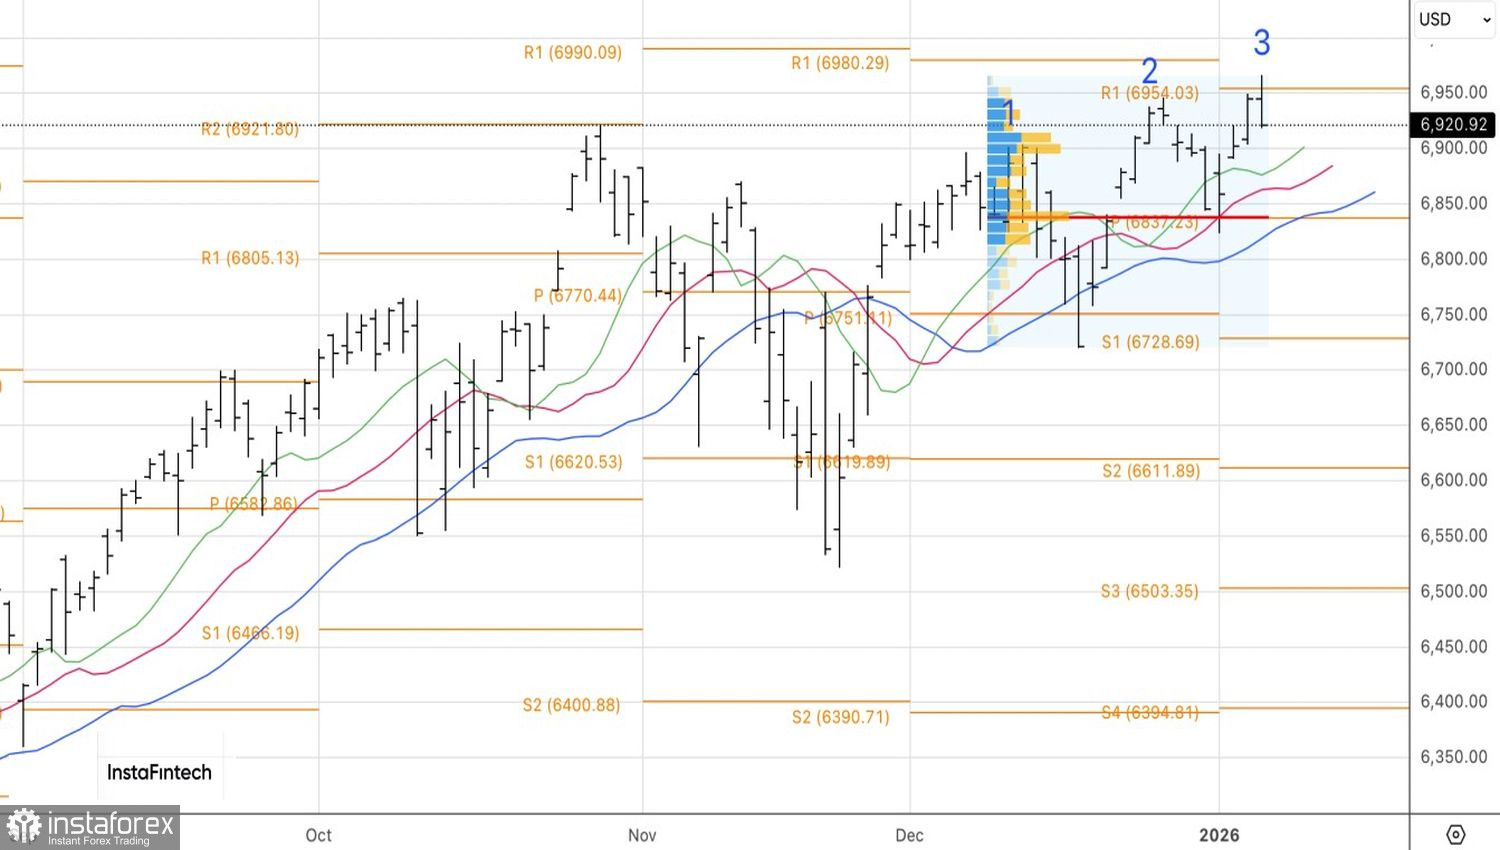
Technically, the daily chart shows that there is a chance that the S&P 500 will form the Three Indians reversal pattern. For that to occur, the price must fall below 6,920. As long as the broad index trades above that level, the focus should remain on buying. Otherwise, it makes sense to prepare a short?term selling strategy.
InstaForex analytical reviews will make you fully aware of market trends! Being an InstaForex client, you are provided with a large number of free services for efficient trading.


